
Bjs 2011 Us Correctional Population Nov 2012
Download original document:
Document text
Document text
This text is machine-read, and may contain errors. Check the original document to verify accuracy.
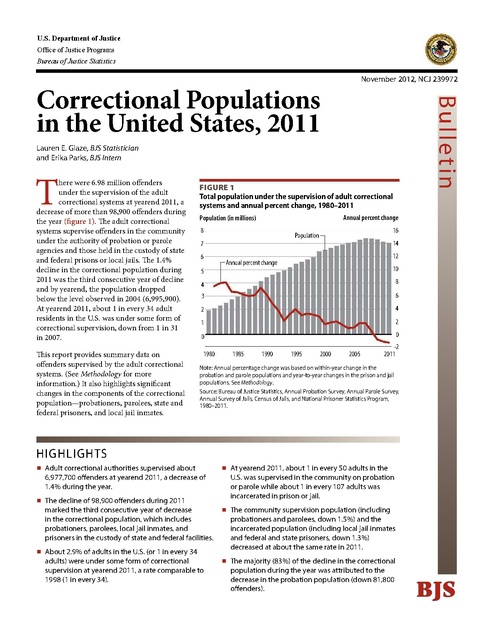
U.S. Department of Justice Office of Justice Programs Bureau of Justice Statistics November 2012, NCJ 239972 Bul l etin Correctional Populations in the United States, 2011 Lauren E. Glaze, BJS Statistician and Erika Parks, BJS Intern T here were 6.98 million offenders under the supervision of the adult correctional systems at yearend 2011, a decrease of more than 98,900 offenders during the year (figure 1). The adult correctional systems supervise offenders in the community under the authority of probation or parole agencies and those held in the custody of state and federal prisons or local jails. The 1.4% decline in the correctional population during 2011 was the third consecutive year of decline and by yearend, the population dropped below the level observed in 2004 (6,995,900). At yearend 2011, about 1 in every 34 adult residents in the U.S. was under some form of correctional supervision, down from 1 in 31 in 2007. This report provides summary data on offenders supervised by the adult correctional systems. (See Methodology for more information.) It also highlights significant changes in the components of the correctional population—probationers, parolees, state and federal prisoners, and local jail inmates. Figure 1 Total population under the supervision of adult correctional systems and annual percent change, 1980–2011 Annual percent change Population (in millions) 8 7 6 ~ 5 4 3 16 Population - 14 12 Annual percent change 10 '\.. ~ 8 6 4 2 2 1 Inli ...... 0 1980 1985 1990 1995 2000 2005 0 -2 2011 Note: Annual percentage change was based on within-year change in the probation and parole populations and year-to-year changes in the prison and jail populations. See Methodology. Source: Bureau of Justice Statistics, Annual Probation Survey, Annual Parole Survey, Annual Survey of Jails, Census of Jails, and National Prisoner Statistics Program, 1980–2011. HIGHLIGHTS Adult correctional authorities supervised about 6,977,700 offenders at yearend 2011, a decrease of 1.4% during the year. The decline of 98,900 offenders during 2011 marked the third consecutive year of decrease in the correctional population, which includes probationers, parolees, local jail inmates, and prisoners in the custody of state and federal facilities. About 2.9% of adults in the U.S. (or 1 in every 34 adults) were under some form of correctional supervision at yearend 2011, a rate comparable to 1998 (1 in every 34). At yearend 2011, about 1 in every 50 adults in the U.S. was supervised in the community on probation or parole while about 1 in every 107 adults was incarcerated in prison or jail. The community supervision population (including probationers and parolees, down 1.5%) and the incarcerated population (including local jail inmates and federal and state prisoners, down 1.3%) decreased at about the same rate in 2011. The majority (83%) of the decline in the correctional population during the year was attributed to the decrease in the probation population (down 81,800 offenders). BJS HJS About 2.9% of adults in the U.S. (or 1 in every 34 adults) were under some form of correctional supervision at yearend 2011 (table 1). The correctional supervision rate observed in 2011 marked the lowest rate of adults in the U.S. under correctional supervision since 2000. The 2011 rate was comparable to the correctional supervision rate observed in 1998 (1 in every 34 adults) when about one million fewer offenders were under correctional supervision (5.9 million in 1998).1 At yearend 2011, the rate of adults in the U.S. who were under supervision in the community on probation or parole (2,015 per 100,000 adults) was more than twice as high as the rate of adults incarcerated in state and federal prisons or local jails (937 per 100,000 adults). (See appendix table 1 for the incarceration rate, which is different from the imprisonment rate published in Prisoners in 2011, BJS website, NCJ 239808, December 2012. See Probation 1See Probation and Parole in the United States, 1998, BJS website, NCJ 178234, August 1999. and Parole in the United States, 2011, BJS website, NCJ 239686, November 2012, for the community supervision rate.) About 1 in every 50 adults in the U.S. was under community supervision and 1 in every 107 adults was incarcerated in 2011. At yearend 2011, about 7 in 10 offenders supervised by the adult correctional systems were on probation or parole, while about 3 in 10 were held in the custody of state and federal prisons or local jails. These findings have remained relatively constant since 2000. Table 1 U.S. adult residents supervised by the adult correctional systems, 2000–2011 Year 2000 2001 2002 2003 2004 2005 2006 2007 2008 2009 2010 2011 Number per 100,000 U.S. adult residentsa 3,060 3,080 3,120 3,150 3,170 3,160 3,190 3,210 3,160 3,090 2,990 2,920 U.S. adult residents under correctional supervision— 1 in 33 1 in 32 1 in 32 1 in 32 1 in 32 1 in 32 1 in 31 1 in 31 1 in 32 1 in 32 1 in 33 1 in 34 Note: Rates are estimated to the nearest 10. Estimates may not be comparable to previously published BJS reports due to updated information. aThe correctional supervision rate was computed using the U.S. adult resident population estimates for January 1 of the following year. Source: Adult correctional population estimates are based on the Bureau of Justice Statistics’ Annual Probation Survey, Annual Parole Survey, Annual Survey of Jails, Census of Jails, and National Prisoner Statistics Program, 2000–2011. The adult resident population estimates are based on U.S. Census Bureau National Intercensal Estimates 2001–2010, and unpublished adult resident population estimates on January 1, 2011, and January 1, 2012. Prison populations: A comparison between the jurisdiction and custody populations BJS’s official measure of the prison population is the count of prisoners under the jurisdiction or legal authority of state and federal adult correctional officials (1,598,780 in 2011). The jurisdiction population count is reported in Prisoners in 2011, BJS website, NCJ 239808, December 2012. These prisoners may be held in prison or jail facilities located outside of the state or federal prison systems. The prison population reported in table 2 in this report is the number held in custody or physically housed in state (1,289,376 in 2011) and federal (214,774 in 2011) adult correctional facilities, regardless of which entity has legal authority over the prisoners (appendix table 1). This includes state and federal prisoners held in privately operated facilities. The difference between the number of prisoners in custody and the number under jurisdiction is the number of state and federal prisoners held in the custody of local jails, inmates out to court, and those in transit from the jurisdiction of legal authority to the custody of a confinement facility outside that jurisdiction. Because table 2 presents data on the number of individuals under the supervision of the adult correctional systems by correctional status, BJS uses the count of the number of prisoners held in custody to avoid double counting prisoners held in local jails. co r r e c t i o n a l p o p u l at i o n s i n t h e u n i t e d s tat e s , 2011 | N o v e m b e r 2012 2 Community supervision and incarcerated populations decreased at about the same rate during 2011 At yearend 2011 about 4,814,200 offenders were supervised in the community either on probation or parole, while about 2,239,800 offenders were incarcerated in state and federal prisons or local jails (table 2). During 2011, the population supervised in the community (down 1.5%) and the incarcerated (down 1.3%) population declined at about the same rate. This was the third consecutive year of decline in both correctional populations. All of the decrease in the number of offenders supervised in the community (down 71,300) on probation or parole was attributed to the decline in the probation population (down 81,800). An increase of 1.6% (13,300 parolees) in the parole population slightly offset the decline observed in the community supervision population during the year.2 During 2011, less than half (43%) of the decrease in the incarcerated population (down 30,400 inmates) was attributed to the decline in the local jail population (down 13,100). In comparison, more than half (57%) of the decrease in the incarcerated population was due to the decline in the number of persons in the custody of state and federal prisons (down 17,300).3 All of the decrease in the total prison population was due to the decline in the number of prisoners held in the custody of state facilities (down 25,100 prisoners or 1.9%), 2A small number of parolees were also on probation during 2011. The total community supervision population and change in the population during the year was adjusted to account for these offenders to avoid double counting. For this reason, the sum of the changes in the probation and parole populations during 2011 does not equal the total change in the community supervision population during the year. See Methodology for more details. 3Changes in the prison population in this report are not comparable to changes in the prison population reported in Prisoners in 2011, BJS website, NCJ 239808, December 2012. This is due to the difference in the custody prison population and the jurisdiction prison population, which is BJS’s official measure of the prison population. See the text box at the bottom of page 2 for more information. including privately operated facilities under state authority (appendix table 1). The increase in the number of prisoners held in the custody of federal facilities (up 7,800 or 3.8%) partially offset the decline in the total prison population during the year. The growth in the federal prison population during 2011 was lead by an increase in the number of federal prisoners held in privately operated facilities under federal authority (up 4,600 or 18.2%). Table 2 Trends in the adult correctional population, by correctional status, 2000–2001, 2005, 2008–2011 Total correctional Year populationa 2000 6,460,000 2001 6,583,500 2005 7,050,900 2008 7,311,600 2009 7,231,400 2010 7,079,500 2011 6,977,700 Average annual percent change, 2000–2010 0.9% Percent change, 2010–2011f -1.4% Community supervision Totalb Probation Parole 4,565,100 3,839,532 725,527 4,665,900 3,934,713 731,147 4,946,800 4,162,495 784,354 5,095,200 4,270,917 828,169 5,017,300 4,198,155 824,115 4,887,900 4,055,514 840,676 4,814,200 3,971,319 853,852 Total 1,937,500 1,961,200 2,195,500 2,307,500 2,292,100 2,270,100 2,239,800 Incarceratedc Jaild Prisone 621,149 1,316,333 631,240 1,330,007 747,529 1,447,942 785,533 1,521,971 767,434 1,524,650 748,728 1,521,414 735,601 1,504,150 0.7% 0.5% 1.5% 1.6% 1.9% 1.4% -1.5% -2.0% 1.6% -1.3% -1.8% -1.1% Note: The change in the total correctional population was based on the sum of the differences in the probation, parole, local jail, and prison custody populations. Estimates were rounded to the nearest 100 and may not be comparable to previously published BJS reports due to updated information. Total community supervision, probation, parole, and prison custody estimates are for December 31 within the reporting year; jail population estimates are for June 30. See Methodology. aEstimates were adjusted to account for some offenders with multiple correctional statuses. For this reason, details do not sum to totals. See Methodology. bIncludes some offenders held in a prison or jail but who remained under the jurisdiction of a probation or parole agency. The 2008 to 2011 estimates were adjusted to account for offenders with dual community supervision statuses. For this reason, details do not sum to totals. See Methodology. cIncludes local jail inmates and prisoners held in the custody of state or federal prisons or privately operated facilities. dTotals were estimated based on the Annual Survey of Jails, except the total for 2005, which is a complete enumeration based on the Census of Jail Inmates. See appendix table 4 for standard errors and Methodology. eIncludes prisoners held in the custody of state and federal prisons or privately operated facilities. The custody prison population is not comparable to the jurisdiction prison population. See text box on page 2 for a discussion about the differences between the two prison populations. See Prisoners in 2011, BJS website, NCJ 239808, December 2012, for information on the jurisdiction prison population, which is BJS’s official measure of the prison population. fThe change in the total correctional population was based on the sum of the differences in the probation, parole, local jail, and prison custody populations. See Methodology for more information on the methods used to calculate annual change within each correctional population. Source: Bureau of Justice Statistics, Annual Probation Survey, Annual Parole Survey, Annual Survey of Jails, Census of Jail Inmates, and National Prisoner Statistics Program, 2000-2011. co r r e c t i o n a l p o p u l at i o n s i n t h e u n i t e d s tat e s , 2011 | N o v e m b e r 2012 3 Fewer probationers during 2011 accounted for most of the decline in the correctional population The probation population (57%) represented the largest component of the correctional population at yearend 2011, relatively consistent since 1980 (61%) (table 3). About 81,800 fewer offenders were on probation at the end of 2011, accounting for most (83%) of the decline in the correctional population during the year. The drop in the number of prisoners held in the custody of state and federal prisons (down 17,300) during 2011 represented about 18% of the decline in the correctional population, while the decrease in the number of local jail inmates (down 13,100) accounted for about 13%. The parole population (up 13,300) was the only correctional population to increase during 2011, partially offsetting the decline in the total correctional population during the year. Table 3 Adult correctional population, by correctional status, 2011 Correctional populations Totala Probationb Paroleb Prisonc Local jaild Multiple correctional statuse Population, 12/31/2011 6,977,700 3,971,319 853,852 1,504,150 735,601 87,200 Percent of total 100% 56.9% 12.2 21.6 10.5 : Population change, 2011 Percent of Number total decline -98,900 100% -81,796 82.7% 13,254 -13.4 -17,264 17.5 -13,127 13.3 : : Note: Estimates were rounded to the nearest 100. Details may not sum to totals due to rounding. :Not calculated. aEquals the sum of each correctional population and excludes the number of offenders with multiple correctional statuses. Change equals the sum of the change for each correctional population. See Methodology. bChange equals the difference between the January 1 and December 31, 2011, populations. cCustody prison population as of December 31. See the text box on page 2 for a discussion of the difference between the custody and jurisdiction prison populations. Change equals the difference between the December 31 custody prison populations for 2010 and 2011. dPopulation is as of the last weekday in June. Change equals the difference between the populations on the last weekday in June 2010 and 2011. eSome probationers and parolees on December 31, 2011, were held in a prison or jail but still remained under the jurisdiction of a probation or parole agency and were excluded from the total correctional population to avoid double counting. See table 4 and Methodology. Source: Bureau of Justice Statistics, Annual Probation Survey, Annual Parole Survey, Annual Survey of Jails, and National Prisoner Statistics Program, 2011. co r r e c t i o n a l p o p u l at i o n s i n t h e u n i t e d s tat e s , 2011 | N o v e m b e r 2012 4 Methodology Sources of data The data were collected through five separate Bureau of Justice Statistics (BJS) data collections: Annual Probation Survey; Annual Parole Survey. BJS’s Annual Probation Survey and Annual Parole Survey began in 1980 and collect data from probation and parole agencies in the U.S. that supervise adults. In these data, adults are persons subject to the jurisdiction of an adult court or correctional agency. Persons under age 18 who were prosecuted as adults in a criminal court are considered adults, but persons under age 18 who were under the jurisdiction of a juvenile court or agency are excluded. The National Criminal Justice Information and Statistics Service of the Law Enforcement Assistance Administration (LEAA), BJS’s predecessor agency, began a statistical series on parole in 1976 and probation in 1979. The Annual Probation Survey and the Annual Parole Survey collect data on (1) the total number of adults supervised in the community on January 1 and December 31 each year, (2) the number of adults who enter and exit supervision during the reporting year, (3) characteristics of the populations at yearend, and (4) other information. Both surveys cover the 50 states, the District of Columbia, and the federal system. BJS relies on the voluntary participation of state central reporters and separate state, county, and court agencies for its annual data on probation and parole. For more information, go to the Probation and Parole Population series page on the BJS website at www.bjs.gov. Annual Survey of Jails. BJS’s Annual Survey of Jails (ASJ) began in 1982. Jails are confinement facilities, usually administered by a local law enforcement agency, that are intended to hold adults. Local jails may also hold inmates under age 18 before or after adjudication (about 5,900 in 2011; See Jail Inmates at Midyear 2011 – Statistical Tables, BJS website, NCJ 237961, April 2012). These inmates are included in the jail population count. The ASJ collects data from a nationally representative sample of local jails and has been conducted annually except for 1983, 1988, 1993, 1999, and 2005 in which a complete census of U.S. local jails was conducted. It collects data on (1) the size of the jail inmate population at midyear, (2) the characteristics of the population, (3) information about jail capacity, and (4) in recent years, data on weekly admissions and releases. BJS relies on the voluntary participation of local jail administrators for the ASJ data. For more information, go to the Prison and Jail Inmates at Midyear series page on the BJS website at www.bjs.gov for the Jail Inmates at Midyear statistical products. Prior to 2007, the Jail Inmates at Midyear statistical products were titled Prison and Jail Inmates at Midyear. Census of Jails. BJS’s Census of Jails (CJS) is part of a series of data collection efforts aimed at studying the nation’s locally administered jails. To reduce respondent burden and improve data quality and timeliness, the census was split into two data collections in 2005 and 2006: the 2005 Census of Jail Inmates (CJI) and the 2006 Census of Jail Facilities (CJF). The census collects data on (1) jail jurisdictions’ supervised populations, which may include inmates under age 18 who were held before or after adjudication, (2) inmate counts and movements, and (3) persons under jail supervision who were supervised outside a jail facility. The Census of Jails began in 1970 and was conducted in 1972, 1978, 1983, 1988, 1993, 1999, 2002, 2005, and 2006. For more information on the 2005 CJI, 2006 CJF, and the original Census of Jails, go to www.bjs.gov. National Prisoner Statistics Program. Begun in 1926 under a mandate from Congress, the National Prisoner Statistics (NPS) program collects data on the number of state and federal prisoners at midyear and yearend. BJS relies on the voluntary participation by state departments of corrections and the Federal Bureau of Prisons for NPS data. The NPS distinguishes between prisoners in custody and prisoners under jurisdiction. To have custody of a prisoner, a state or federal correctional authority must physically house a prisoner in one of its facilities or in a private facility under its authority. To have jurisdiction over a prisoner, a state or federal prison must have legal authority over the prisoner, regardless of where the prisoner is held. These prisoners may be held in prison or jail facilities located outside of the state or in the federal prison system. The prison data in this report reflect the NPS custody counts and they include all inmates held within a respondent’s facilities, including inmates housed for other correctional facilities, prisoners held in privately operated facilities, prisoners under age 18 who were serving time in a state or federal correctional facility after being sentenced as an adult in a criminal court (1,790 in 2011), and inmates in the six states in which prisons and jails form one integrated system, including inmates under age 18 who may have been held before or after adjudication.4 Probation and parole populations Total correctional population counts reflect data reported by probation and parole agencies within the specific reporting year. While some agencies update their probation and parole data for different reasons after submitting their data, BJS does not obtain updated data for prior years. Updated data usually include data that were not entered into the information system before the survey was submitted or data that were not fully processed by yearend. Probation and parole agencies also experience changes in reporting methods over time. (See Probation and Parole in the United States, 2011, BJS website, NCJ 239686, December 2012.) Therefore, probation and parole population counts on January 1 of the current year may differ from population counts on December 31 of the prior reporting year. 4See Prisoners in 2011, BJS website, NCJ 239808, December 2012, for more information about the six states with combined prison and jail systems. co r r e c t i o n a l p o p u l at i o n s i n t h e u n i t e d s tat e s , 2011 | N o v e m b e r 2012 5 The number of offenders supervised by the adult correctional systems in each year reflect the population counts reported by probation and parole agencies within the reporting year. For example, the 2010 probation and parole totals are the December 31, 2010, population counts reported by the agencies for the 2010 reporting year. This method was first adopted with Correctional Populations in the United States, 2010, BJS website, NCJ 236319, December 2011. In previously published BJS reports, the December 31 probation and parole population counts within a reporting year were updated with the January 1 probation and parole population counts from the next reporting year. The total correctional population counts within a year in previously published BJS reports included the January 1 probation and parole population counts from the next reporting year. This former method was previously used to facilitate the estimation of annual change in the total correctional population, as well as the probation and parole populations, by attempting to account for annual reporting changes or updated data. However, for this report, BJS used the newer method to estimate annual change in the total correctional population, and the probation and parole populations. This method is comparable to the method used for the 2010 report. (See Estimating annual change in the total correctional populations, page 7.) Local jail and custody prison population Counts adjusted for offenders with multiple correctional statuses Respondents to the ASJ are asked to report the number of jail inmates confined as of the last weekday in June of each year. The total correctional population counts in each year include jail population counts as of the last weekday in June for all inmates confined in local jails. This is used as an estimate of the number in local jails at yearend. Offenders under correctional supervision may have multiple correctional statuses for several reasons. For example, probation and parole agencies may not always be notified immediately of new arrests, jail admissions, or prison admissions; absconders included in a probation or parole agency’s population in one jurisdiction may actually be incarcerated in another jurisdiction; individuals may be admitted to jail or prison before formal revocation hearings and potential discharge by a probation or parole agency; and individuals may be serving separate probation and parole sentences concurrently. Respondents to the NPS are asked to report separate population counts of the number of prisoners in the custody of and under the jurisdiction of state or federal correctional facilities on December 31 of each year. The total correctional population count in each year reflects the custody prison populations as of December 31, and differs from the jurisdiction population counts reported in Prisoners in 2011, BJS website, NCJ 239808, December 2012. In 1998, BJS began collecting data on the number of offenders with multiple correctional statuses and has expanded on the information collected since then. Table 4 includes the adjustments that were made to the total correctional population to exclude offenders with multiple correctional statuses. Table 4 Offenders with multiple correctional statuses at yearend, by correctional status, 1998–2011 Year 1998 1999 2000 2001 2002 2003 2004 2005 2006 2007 2008 2009 2010 2011 Total 49,500 46,700 42,500 43,600 50,300 47,000 56,000 91,400 92,000 75,800 95,000 82,900 86,800 87,200 Probationers in— State or Local jails federal prisons 28,800 20,700 23,900 22,800 20,400 22,100 23,400 20,200 29,300 20,900 25,500 21,500 34,400 21,600 32,600 22,100 33,900 21,700 19,300 23,100 23,800 32,400 21,400 23,100 21,300 21,500 21,100 22,300 In local jails -------18,300 20,700 18,800 19,300 19,100 21,400 18,000 Parolees— In state or federal prisons -------18,400 15,700 14,600 15,600 14,300 14,400 14,900 On probation ----------3,900 5,000 8,300 11,000 Note: Estimates may not be comparable to previously published BJS reports due to updated information. Details may not sum to totals due to rounding. --Not collected or excluded from total correctional population. Source: Bureau of Justice Statistics, Annual Probation Survey, Annual Parole Survey, 1998–2011. co r r e c t i o n a l p o p u l at i o n s i n t h e u n i t e d s tat e s , 2011 | N o v e m b e r 2012 6 These estimates are based on reported data provided by the probation and parole agencies that were capable of providing the information within the specific reporting year. Because some probation and parole agencies did not provide these data each year, the numbers may underestimate the total number of offenders with multiple correctional statuses between 1998 and 2011. Due to these adjustments, the sum of the four correctional populations in tables 2 and 3 will not equal the total correctional population. In addition, the sum of the probation and parole populations for 2008 through 2011 will not equal the total community supervision population because the total was adjusted for parolees who were also on probation. Estimating annual change in the correctional populations The probation and parole population counts on January 1 of the current year may differ from population counts on December 31 of the prior reporting year, because probation and parole agencies may update their data (See Probation and parole populations on page 5), change their reporting methods from one year to the next, or discharge offenders on January 1 of each year. For these reasons, annual change in the probation and parole populations was calculated within the reporting year. (See Methodology in Probation and Parole in the United States, 2011, BJS website, NCJ 239686, December 2012 for more information.) The annual change in the community supervision population was also calculated within the reporting year. For years 2008 through 2011, change in the community supervision population was calculated after accounting for offenders with multiple community supervision statuses. (See Counts adjusted for offenders with multiple correctional status on page 6.) For these reasons, in years 2008 through 2011, the sum of the changes in the probation and parole populations does not equal the total change in the community supervision population. For example, the change in the probation population (down 81,800) during 2011 plus the change in the parole population (up 13,300) during the year does not equal the total change in the community supervision population (down 71,300). The difference (up 2,800) is the change in the number of parolees who were also on probation during 2011. The annual change in the jail and custody prison populations was based on the change from the prior year to the current year because respondents are only asked to report a population count for one reference date. For example, the annual change in the jail population for 2011 is the difference (down 13,100) between the populations on the last weekday in June 2010 and June 2011. The annual change in the custody prison population for 2011 is the difference (down 17,300) between the December 31, 2010, and December 31, 2011, custody prison populations. The change in the total incarcerated population was calculated as the sum of the change in the jail and custody prison populations from the prior year to the current year. The annual change in the total correctional population for each year was not calculated as the difference in the total correctional population from the prior year and the current year but rather the sum of the annual changes for each correctional population. For example, the annual change in the total correctional population (down 98,900) during 2011 was calculated as the sum of four components: (1) the change in the probation population (down 81,800) in 2011; (2) the change in the parole population (up 13,300) in 2011; (3) the change in the jail population (down 13,100), or the difference between the populations on the last weekday in June 2010 and June 2011; and (4) the change in the custody prison population (down 17,300), or the difference between the December 31 populations in 2010 and 2011. Probation coverage expanded beginning in 1998 through 1999 To address survey undercoverage, the number of probation agencies was expanded beginning in 1998 and continued through 1999 to include misdemeanor probation agencies in a few states that fell within the scope of this survey. In 1998, survey coverage was expanded to include 35 additional probation agencies, which accounted for 27,644 additional probationers. Expansion of probation coverage continued through 1999, and in that year an additional 178 probation agencies were added to the collection, which accounted for 259,744 additional probationers. Therefore, the 1998 total correctional population reported in figure 1 includes 27,644 probationers added through the expansion of coverage in 1998. The 1999 correctional population reported in figure 1 includes 259,744 probationers added through the expansion of coverage in 1999. To calculate the annual change in the total correctional population between 1997 and 1998, the 27,644 probationers added through the expansion of coverage in 1998 were subtracted from the 1998 total correctional population reported in figure 1. The 259,744 probationers added through the expansion of coverage in 1999 were subtracted from the 1999 correctional population total in order to calculate the annual change between 1998 and 1999. co r r e c t i o n a l p o p u l at i o n s i n t h e u n i t e d s tat e s , 2011 | N o v e m b e r 2012 7 Appendix Table 1 Inmates held in custody in state or federal prisons or in local jails, December 31, 2000, 2010–2011 Inmates in custody Total Federal prisonersa Prisons Federal facilities Privately operated facilities Community Corrections Centersb State prisoners State facilities Privately operated facilities Local jailsc Incarceration rated Adult incarceration ratee 2000 1,937,482 140,064 133,921 124,540 9,381 6,143 1,176,269 1,100,978 75,291 621,149 683 918 Number of inmates 2010 2,270,142 206,968 198,339 173,138 25,201 8,629 1,314,446 1,220,331 94,115 748,728 731 960 2011 2,239,751 214,774 206,004 176,228 29,776 8,770 1,289,376 1,196,981 92,395 735,601 716 937 Average annual change, 2000–2010 1.6% 3.9% 3.9 3.3 9.9 3.4 1.1% 1.0 2.2 1.9% 0.7% 0.5 Percent change, 2010–2011 -1.3% 3.8% 3.9 1.8 18.2 1.6 -1.9% -1.9 -1.8 -1.8% -2.0% -2.3 Note: Estimates may not be comparable to previously published BJS reports due to updated information. Total includes all inmates held in local jails, state or federal prisons, or privately operated facilities. It does not include inmates held in U.S. territories (appendix table 2), military facilities (appendix table 3), U.S. Immigration and Customs Enforcement facilities, jails in Indian country, and juvenile facilities. See Methodology for sources of incarceration data and the text box on page 2 for a discussion of the differences between the custody and jurisdiction prison populations. aIn 2001, responsibility for sentenced prisoners from the District of Columbia was transferred to the Federal Bureau of Prisons. bNon-secure, privately operated community corrections centers. cCounts for inmates held in local jails are for the last weekday in June of each year. Counts were estimated from the Annual Survey of Jails. See Methodology. dThe total number in the custody of local jails, state or federal prisons, or privately operated facilities as of December 31, 2011, per 100,000 U.S. residents. Resident population estimates are from the U.S. Census Bureau for January 1 of the following year. eThe total number in custody as of December 31, 2011 per 100,000 U.S. residents age 18 or older. Adult resident population estimates are from the U.S. Census Bureau for January 1 of the following year. See Methodology for information on inmates under the age of 18 who were in prison after being sentenced as adults or being held in local jails before or after adjudication. Source: Bureau of Justice Statistics, Annual Survey of Jails, and National Prisoner Statistics Program, 2000 and 2010–2011. The total and adult resident population estimates are based on U.S. Census Bureau National Intercensal Estimates 2001, and unpublished total and adult resident population estimates, January 1, 2011, and January 1, 2012. Appendix Table 2 Prisoners in custody of correctional authorities in the U.S. territories and commonwealths, 2011 Jurisdiction Totalb American Samoa Guam Commonwealth of the Northern Mariana Islands Commonwealth of Puerto Rico U.S. Virgin Islands Total number of prisoners 12,413 167 632 162 11,452 -- Sentenced to more than 1 year Number Incarceration rate, 2011a 9,641 243 117 212 240 150 91 174 9,193 248 -: -- Not reported. : Not calculated. aThe number of prisoners with a sentence of more than 1 year per 100,000 persons in the resident population on July 1, 2011. bExcludes the U.S. Virgin Islands. Source: Bureau of Justice Statistics, National Prisoner Statistics Program, 2011. Resident population estimates are based on U.S. Census Bureau International Database estimates. co r r e c t i o n a l p o p u l at i o n s i n t h e u n i t e d s tat e s , 2011 | N o v e m b e r 2012 8 Appendix Table 3 Prisoners under military jurisdiction, by branch of service, 2010–2011 Branch of service Total Prisoners who served in— Air Force Army Marine Corps Navy Coast Guard Prisoners held by— Air Force Army Marine Corps Navy 2010 1,475 Total Percent change, 2011 2010–2011 1,527 3.5% Sentenced to more than 1 year Percent change, 2010 2011 2010–2011 913 1,051 15.1% 269 619 378 201 8 285 702 299 235 6 5.9 13.4 -20.9 16.9 -25.0 177 425 155 155 1 204 512 157 176 2 15.3 20.5 1.3 13.5 100.0 48 719 177 531 54 828 102 543 12.5 15.2 -42.4 2.3 8 571 11 323 5 678 5 363 -37.5% 18.7 -54.5 12.4 Source: Bureau of Justice Statistics, National Prisoner Statistics Program, 2010–2011. Appendix Table 4 Estimated standard errors for local jail inmates, 2000, 2001, and 2008–2011 Year 2000 2001 2008 2009 2010 2011 Total 621,149 631,240 785,533 767,434 748,728 735,601 Standard error 2,551 2,721 4,276 4,453 5,638 6,168 Relative standard error (percent)* 0.41% 0.43 0.54 0.58 0.75 0.84 *Calculated by dividing the standard error by the survey estimate and multiplying by 100. Source: Bureau of Justice Statistics, Annual Survey of Jails, 2000, 2001, and 2008–2011. co r r e c t i o n a l p o p u l at i o n s i n t h e u n i t e d s tat e s , 2011 | N o v e m b e r 2012 9 The Bureau of Justice Statistics is the statistics agency of the U.S. Department of Justice. James P. Lynch is director. Lauren E. Glaze and Erika Parks wrote this report. Lauren E. Glaze and Erika Parks analyzed the data and prepared the tables and graphs with assistance from E. Ann Carson. Todd Minton and E. Ann Carson provided statistical verification. Sheri Simmons provided statistical review. Doris J. James edited the report, and Barbara Quinn and Tina Dorsey produced the report under the supervision of Doris J. James. November 2012, NCJ 239972 Office of Justice Programs Innovation • Partnerships • Safer Neighborhoods www.ojp.usdoj.gov