
Bjs Study Black Victims of Violent Crime 2007
Download original document:
Document text
Document text
This text is machine-read, and may contain errors. Check the original document to verify accuracy.
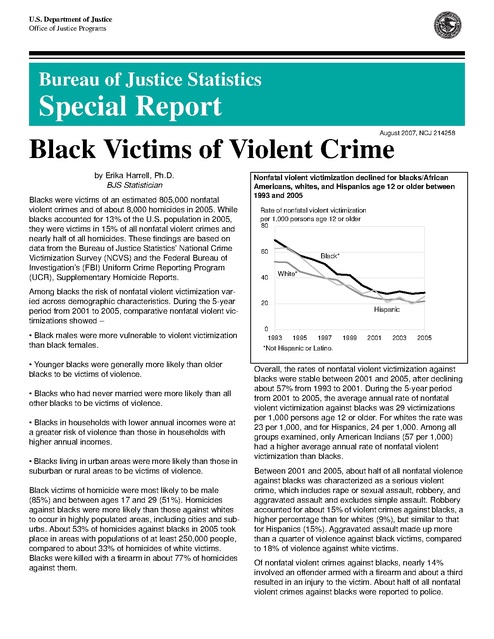
U.S. Department of Justice
Office of Justice Programs

Bureau of Justice Statistics

Special Report
August 2007, NCJ 214258

Black Victims of Violent Crime
by Erika Harrell, Ph.D.
BJS Statistician
Blacks were victims of an estimated 805,000 nonfatal
violent crimes and of about 8,000 homicides in 2005. While
blacks accounted for 13% of the U.S. population in 2005,
they were victims in 15% of all nonfatal violent crimes and
nearly half of all homicides. These findings are based on
data from the Bureau of Justice Statistics’ National Crime
Victimization Survey (NCVS) and the Federal Bureau of
Investigation’s (FBI) Uniform Crime Reporting Program
(UCR), Supplementary Homicide Reports.
Among blacks the risk of nonfatal violent victimization varied across demographic characteristics. During the 5-year
period from 2001 to 2005, comparative nonfatal violent victimizations showed –
• Black males were more vulnerable to violent victimization
than black females.
• Younger blacks were generally more likely than older
blacks to be victims of violence.
• Blacks who had never married were more likely than all
other blacks to be victims of violence.
• Blacks in households with lower annual incomes were at
a greater risk of violence than those in households with
higher annual incomes.
• Blacks living in urban areas were more likely than those in
suburban or rural areas to be victims of violence.
Black victims of homicide were most likely to be male
(85%) and between ages 17 and 29 (51%). Homicides
against blacks were more likely than those against whites
to occur in highly populated areas, including cities and suburbs. About 53% of homicides against blacks in 2005 took
place in areas with populations of at least 250,000 people,
compared to about 33% of homicides of white victims.
Blacks were killed with a firearm in about 77% of homicides
against them.

Nonfatal violent victimization declined for blacks/African
Americans, whites, and Hispanics age 12 or older between
1993 and 2005
Rate of nonfatal violent victimization
per 1,000 persons age 12 or older
80

60

40

Black*
White*

20

Hispanic
0
1993

1995

1997

1999

2001

2003

2005

*Not Hispanic or Latino.

Overall, the rates of nonfatal violent victimization against
blacks were stable between 2001 and 2005, after declining
about 57% from 1993 to 2001. During the 5-year period
from 2001 to 2005, the average annual rate of nonfatal
violent victimization against blacks was 29 victimizations
per 1,000 persons age 12 or older. For whites the rate was
23 per 1,000, and for Hispanics, 24 per 1,000. Among all
groups examined, only American Indians (57 per 1,000)
had a higher average annual rate of nonfatal violent
victimization than blacks.
Between 2001 and 2005, about half of all nonfatal violence
against blacks was characterized as a serious violent
crime, which includes rape or sexual assault, robbery, and
aggravated assault and excludes simple assault. Robbery
accounted for about 15% of violent crimes against blacks, a
higher percentage than for whites (9%), but similar to that
for Hispanics (15%). Aggravated assault made up more
than a quarter of violence against black victims, compared
to 18% of violence against white victims.
Of nonfatal violent crimes against blacks, nearly 14%
involved an offender armed with a firearm and about a third
resulted in an injury to the victim. About half of all nonfatal
violent crimes against blacks were reported to police.

Violent victimization rates for blacks declined from
1993 to 2001 but were stable from 2001 to 2005
The overall rate of nonfatal violent victimization against
blacks declined by nearly 57% between 1993 and 2001
(table 1). The rate for the overall population declined 54%
during the period (not shown in table). Except for persons
age 50 or older, the violent victimization rates declined for
all subgroups of the black population that were examined.
The decline for black males (61%) was somewhat greater
than for black females (53%) (figure 1). By location of
residence, from 1993 to 2001 the decline in the rates of
violent victimization for blacks in urban areas was smaller
than for blacks in rural areas and slightly larger than for
those in suburban areas (figure 2).
Violent victimization of blacks/African Americans,
by gender, 1993-2005

80

Male

Female

20

1995

1997

Table 1. Violent victimization rates of blacks/African
Americans by gender, age, and location of residence,
1993, 2001, and 2005

1999

2001

2003

2005

Figure 1

Rate of violent victimization per 1,000 black
persons age 12 or older
100

29.7

28.6

-57.1%†

-3.7%ns

Gender
Male
Female

79.7
60.6

31.4
28.4

33.0
25.0

-60.7%†
-53.2†

5.3%ns
-11.9ns

133.0
124.9
119.6
61.5
62.6
18.4
11.0

51.3
69.5
38.3
29.5
22.6
18.8
4.7*

46.5
71.9
51.4
29.5
20.1
16.1
1.1*

-61.4%†
-44.4†
-68.0†
-52.0†
-64.0†
2.3ns
-57.1ns

-9.4%ns
3.4ns
34.3ns
0.1ns
-11.0ns
-14.7ns
-77.8ns

38.2
24.9
9.3

37.3
20.2
18.2

-56.0%†
-54.2†
-74.9†

-2.2%ns
-18.9 ns
95.0ns

Location of residence
Urban
86.7
Suburban
54.3
Rural
37.2

40

Suburban

0
1993

1997

*

Based on 10 or fewer sample cases.

The survey provides the largest national forum for
victims to describe their experiences of victimization,
the impact of crime, and the characteristics of violent
offenders.

Rural

1995

statistically significant.

Significant at 0.95.

The NCVS is the Nation’s primary source of information
on the frequency, characteristics, and consequences of
criminal victimization. One of the largest continuous
household surveys conducted by the Federal
Government, the NCVS collects information about
crimes both reported and not reported to police.

Urban

20

†

The National Crime Victimization Survey

80
60

Percent change
1993-2001 2001-2005

69.3

nsNot

Violent victimization of blacks/African Americans
by location of residence, 1993-2005

Violent victimization rate
1993
2001 2005

Total

Age
12-15
16-19
20-24
25-34
35-49
50-64
65 or older

60

0
1993

In 2005 black males were somewhat more vulnerable to
violent crimes than black females. Blacks age 24 and under
had higher rates of violent victimization than blacks age 25
or older. Blacks living in urban areas had the highest rates
of violent victimization in 2005, and those in rural areas had
the lowest rates.

Characteristic
of victim

Rate of violent victimization per 1,000 black
persons age 12 or older
100

40

Between 2001 and 2005, the rate of nonfatal violent crimes
against blacks did not change significantly despite
apparent fluctuations for some subgroups. For the overall
population the rate was stable. During this period, there
were no significant changes in the rates of violent
victimization by gender, age, or location of residence.

1999

Figure 2

2 Black Victims of Violent Crime

2001

2003

2005

For current overall estimates of criminal victimization in
the United States, see Criminal Victimization, 2005, at
<www.ojp.usdoj.gov/bjs/abstract/cv05.htm>. Other
findings from the NCVS are also on the BJS website.

In 2005 nearly half of all homicide victims were black
Blacks accounted for 49% of all homicide victims in 2005,
according to the FBI's UCR.* Black males accounted for
about 52% (or 6,800) of the nearly 13,000 male homicide
victims in 2005. Black females made up 35% (or 1,200) of
the nearly 3,500 female homicide victims. The number of
black males murdered increased between 2004 and 2005,
while the number of black females murdered remained the
same (figure 3). A higher percentage of black homicide victims (36%) than white victims (26%) were ages 13 to 24.
About half (51%) of black homicide victims were ages 17 to
29, compared to about 37% of white victims.
Homicides against blacks were more likely than those
against whites to occur in highly populated areas, including
cities and suburbs. About half (53%) of black homicides in
2005 took place in areas with populations of at least
250,000 people. A third (33%) of white homicides occurred
in places with that size population.
In 2005 most homicides involving one victim and one
offender were intraracial. About 93% of black homicide victims and 85% of white victims in single victim and single
offender homicides were murdered by someone of their
race. Women were the offenders in about 10% of single
victim and single offender homicides of both blacks and
whites.
Intimate partners (current or former spouses, boyfriends, or
girlfriends, including same-sex relationships) were responsible for relatively fewer homicides among blacks (6%) than
among whites (12%) in 2005. Gang violence accounted for
about 5% of black homicides and about 7% of white homicides. Blacks were killed with firearms in about 77% of
homicides against them in 2005, compared to 60% of white
homicide victims.
*For

overall estimates of homicides, see Homicide Trends in the United

States <www.ojp.usdoj.gov/bjs/homicide/homtrnd.htm>.

Homicide victims by race and gender of the victim,
1993-2005
Number of homicide victims
12,500
10,000

Black male

7,500

Black/African
Americana
Whitea
American Indian/
Alaska Nativea
Asian/Pacific
Islandera
Hispanic/Latino

Rate per 1,000 persons age 12 or older
Assault
Total vio- Rape/sexual
lent crime assault
Robbery Aggravated Simple
28.7
22.8

1.7
0.9

4.3
2.0

7.7
4.2

14.9
15.7

56.8

0.9b

4.8b

11.6

39.5

10.6
24.3

b

2.3
3.6

1.7
5.3

6.2
14.5

White female

2,500

Black female
1997

1999

2001

2003

2005

0.5
0.8

a

Not Hispanic or Latino.

b

Based on 10 or fewer sample cases.

Violent crime rates between 2001 and 2005 were higher
for blacks than for whites, Hispanics, and Asians
Between 2001 and 2005 blacks had higher rates of violent
victimization than whites, Hispanics, and Asians (table 2).
American Indians were the only group that had rates higher
than blacks.
Blacks were more likely to experience an aggravated
assault than whites or Hispanics
Between 2001 and 2005 the average annual rate of aggravated assault for blacks (8 per 1,000 persons age 12 or
older) was nearly twice that of whites (4 per 1,000) and
slightly higher than that of Hispanics (5 per 1,000). While
blacks were more likely than whites to experience aggravated assault, blacks and whites were equally likely to
experience a simple assault during the 5-year period.
Blacks were at a greater risk of rape or sexual assault than
any other racial/ethnic group except American Indians.
Serious violent crime made up nearly half of nonfatal
violent crimes against blacks between 2001 and 2005
Serious violent victimization consists of rape or sexual
assault, robbery, and aggravated assault. It usually
involves serious injury to the victim or an offender armed
with a weapon. These offenses comprised about 48% of
the violent crimes against blacks between 2001 and 2005,
a percentage higher than that for whites, American Indians
and Hispanics but similar to that of Asians.

Black/African American*
White*
American Indian/Alaska
Native*
Asian/Pacific Islander*
Hispanic/Latino

5,000

1995

Race/Hispanic
origin

Race/Hispanic
origin

White male

0
1993

Table 2. Average annual violent victimization rate by race/
Hispanic origin and type of crime, 2001-2005

Serious violent crime as a percent of all nonfatal violent crime,
2001-2005
48.0%
31.0
30.5
42.1
40.1

*Not Hispanic or Latino.

Note: Excludes victims of other races and unknown race.
Data include Hispanic or Latino persons.
Figure 3

Black Victims of Violent Crime 3

Among blacks, males and those in urban areas were
the most vulnerable to robbery victimization
Between 2001 and 2005, blacks were victims of an average of about 121,000 robberies per year, representing an
average annual robbery victimization rate of about 4 per
1,000 blacks age 12 or older. This was higher than the rate
for whites and similar to that for Hispanics. Between 2001
and 2005, robberies made up about 15% of all violent
crime against blacks, a percentage higher than that for
whites and similar to that for Hispanics (see appendix
table 5).

About 40% of black robbery victims faced an offender
armed with a firearm (table 4). They were more likely than
white and Hispanic robbery victims to face an offender with
a firearm. Blacks were as likely as Hispanics and whites to
be injured during a robbery.
The rate of robbery victimization for blacks decreased from
about 13 per 1,000 persons age 12 or older in 1993 to
about 4 per 1,000 in 2001 (figure 4). There was no difference between the 2001 and 2005 rates of robbery for
blacks.
Robbery victimization by victim race/Hispanic origin,
1993-2005

Between 2001 and 2005, blacks ages 12 to 19 made up
about 37% of all black robbery victims, a percentage similar
to that for Hispanics (table 3). Males made up the majority
of robbery victims among blacks, whites and Hispanics.
About a third of black robbery victims lived in households
with annual incomes of less than $15,000.

Rate of robbery victimization per 1,000
persons age 12 or older
20

15

Black robbery victims were less likely than white victims
and as likely as Hispanic robbery victims to live in households with annual incomes of at least $50,000. Black robbery victims (65%) were more likely than white robbery victims (41%) to live in urban areas.

10

Black*

Hispanic
5

White*

Table 3. Robbery victimization by gender, age, annual
household income, and location of residence, by race/
Hispanic origin, 2001-2005
Characteristic
of robbery victim

Percent of robbery crimes
Black/African
Hispanic/
Americana
Whitea Latino

Total

100%

100%

100%

Gender
Male
Female

66.7%
33.3

64.5%
35.5

65.9%
34.1

Age
12-19
20-24
25-34
35-49
50-64
65 or older

36.9%
11.9
20.2
17.6
10.1
3.2b

21.9%
18.0
18.5
24.1
12.0
5.5

27.4%
18.1
27.9
16.3
7.4
2.9b

Annual household income
Less than $7,500
$7,500 to $14,999
$15,000 to $24,999
$25,000 to $34,999
$35,000 to $49,999
$50,000 or more

17.2%
18.0
21.4
15.6
10.7
17.0

10.7%
11.7
12.8
12.1
14.1
38.5

5.3%b
15.4
27.7
17.6
16.6
17.4

Location of residence
Urban
Suburban
Rural

64.7%
27.6
7.7

41.0%
47.8
11.2

Note: Detail may not add to 100% due to rounding.
aNot
b

0
1993

Hispanic or Latino.

Based on 10 or fewer sample cases.

4 Black Victims of Violent Crime

68.8%
30.7
0.5b

1995

1997

1999

2001

2003

2005

*Not Hispanic or Latino.
Figure 4

Table 4. Weapons present and injuries sustained by victim
during robbery, by victim race/Hispanic origin, 2001-2005
Characteristic
of robbery incident
Total
Presence and type of weapon
No weapon
Weapon
Firearm
Knife
Other
Unknown
Do not know if offender had
weapon
Injury
Not injured
Injured

Percent of robbery crimes
Hispanic/
Black/African
Whitea Latino
Americana
100%

100%

100%

28.4%
57.3
39.8
7.9
6.6
3.1b

43.1%
45.2
21.4
12.0
9.8
2.0

37.8%
47.5
24.4
14.9
7.7
0.5b

14.2

11.7

14.7

66.1%
33.9

61.6%
38.4

64.5%
35.5

Note: Excludes persons who did not know if they had been injured.
Detail may not add to total due to rounding.
aNot
b

Hispanic or Latino.

Based on 10 or fewer sample cases.

Most nonfatal violence against blacks was intraracial;
victim/offender relationship varied by victim gender
About four-fifths of black victims of nonfatal violence perceived the offenders to be black (table 5). About 12% of
black victims perceived the offender to be white, while
about 8% thought the offender was neither black nor white
(categorized as other races on table 5). Blacks (78%) were
more likely to be victims of intraracial violence than whites
(70%).
Black males were more likely to be violently victimized by
strangers than black females (table 6). Black female victims
of violent crime were more likely than black male victims to
be victimized by an intimate partner. Intimate partner violence accounted for 21% of violent victimizations against
black females, compared to about 5% of victimizations
against black males. The gender disparity for intimate partner violence among blacks was similar to that for other victims.
Rate of nonfatal gang violence against blacks was
about 3 per 1,000 between 2001 and 2005
The rate of violent crimes against blacks that were
committed by offenders who were perceived to be gang
members was higher than that for whites and Asians but
similar to that for Hispanics and American Indians.
Race/Hispanic origin of victims
who perceived offender to be a
gang member

Rate per 1,000 persons
age 12 or older, 2001-2005

Black/African Americana
Whitea
American Indian/Alaska Nativea
Asian/Pacific Islandera
Hispanic/Latino
aNot
b

Between 2001 and 2005 blacks perceived the offender to
be a member of a street gang in about 9% of violent crimes
against them. In 43% of violence against blacks, the victim
did not know if the offender was a gang member.
Percent of nonfatal
violent crime against
blacks, 2001-2005

Victims perceived offender
to be a gang member
Gang member
Not a gang member
Unsure of gang membership

9.1%
47.8
43.0

Note: Detail may not add to 100% due to rounding.

A quarter of violence against blacks was committed by
offenders under the influence of alcohol or drugs
Black victims were less likely than white victims, somewhat
less likely than American Indian victims, and as likely as
Asian and Hispanic victims to face an offender under the
influence of alcohol or drugs. About 25% of nonfatal
violence against blacks involved an offender perceived to
be under the influence of alcohol or drugs. The victim did
not know if the offender was under the influence of alcohol
or drugs in 48% of violence against blacks (not shown on
table).
Race/Hispanic origin of victims
who perceived offender to be
under the influence of
alcohol or drugs

Percent of violent crime,
2001-2005

Black/African American*
White*
American Indian/Alaska Native*
Asian/Pacific Islander*
Hispanic/Latino

2.5
0.9
1.8b
0.5b
2.7

25.3%
31.2
39.5
23.4
26.9

*Not Hispanic or Latino.

Hispanic or Latino.

Based on 10 or fewer sample cases.

Table 5. Percent of violent victimization, by victim race/
Hispanic origin and offender race, 2001-2005

Table 6. Victim/offender relationship of black/African
American victims and other victims, by gender, 2001-2005

Victim race/Hispanic origin
Black/African
American Indian/ Asian/Paci- Hispanic/
Americanb
Whiteb Alaska Nativeb fic Islanderb Latino

Offender
racea
Total
White
Black/African
American
Other races
Two or more
races

100%
11.5

100%
69.7

100%
47.3

100%
37.1

100%
46.9

77.7
8.2

15.1
12.0

12.4
37.9

26.8
34.3

19.4
30.0

2.6

3.2

2.6c

1.8c

3.7

Victim/offender
relationship

Percent of violent victimization
Black/African
American victimsa
Other victimsb
Male
Female
Male
Female

Total
Intimate
Other relatives
Well known/casual
acquaintance
Stranger

100%
4.6
3.9

100%
20.9
7.9

100%
3.5
4.7

100%
21.6
9.1

35.6
55.9

37.9
33.4

34.1
57.7

35.9
33.4

Note: The other offender race category includes American Indians, Alaska
Natives, Asians, and other Pacific Islanders. The two or more race category
includes offenders who were of more than one race. Excludes data in which
race of the offender was unknown.

Note: Excludes data in which the victim/offender relationship was
unknown. Detail may not add to 100% due to rounding.

aIncludes

non-Hispanic whites, non-Hispanic American Indians, nonHispanic Asians and other Pacific Islanders, and Hispanic or Latino
persons of any race.

b

Hispanic or Latino persons.

Not Hispanic or Latino.

a

Not Hispanic or Latino.

bIncludes

c

Based on 10 or fewer sample cases.

Black Victims of Violent Crime 5

About 1 in 7 black victims of nonfatal violence were
confronted by an offender with a firearm
Between 2001 and 2005, about 35% of all violent crime
against blacks involved offenders with a weapon. Weapons
included firearms, knives, and other objects used as a
weapon. Black victims were more likely than whites,
American Indians, and Hispanics to face an offender with a
weapon. They were somewhat more likely than Asians to
face an offender with a weapon.
Black victims were as likely as Asian victims and more
likely than victims of other racial or ethnic groups to face an
offender with a firearm. Black victims faced an offender
armed with firearms in about 14% of nonfatal violence
against them.
Race/Hispanic
origin
Black/African Americana
Whitea
American Indian/Alaska
Nativea
Asian/Pacific Islandera
Hispanic/Latino

Percent of violent crime, 2001-2005
Weapon
Firearm
35.1%
21.3

14.3%
6.6

21.4
25.8
28.8

2.2b
10.2
9.7

a

Not Hispanic or Latino.

b

Based on 10 or fewer sample cases.

About a third of black victims of nonfatal violence were
injured during the crime
Black victims sustained an injury in about 31% of all
nonfatal violent crime between 2001 and 2005. About 54%
of injured black victims of violence did not receive
treatment for their injuries (table 7). About a quarter of
injured black victims were treated as outpatients in a
hospital or hospital emergency department.
Injured black victims of serious violent crime (52%) were
more likely to be treated than those injured in a simple
assault (37%) (table 8). Simple assault usually involves
less serious injuries than serious violent crime.

Table 7. Injury and treatment of black/African American
victims of violent crime, 2001-2005
Injury and treatment
Total

Percent of violent victimization
All
Injured
100%

Not injured

68.9%

Injured
Not treated
Treated
At scene, home, neighbors,
or friends
Doctor's office, clinic, health
unit, stadium, park
Hospital
Not admitted
Overnight stay
Other locations

31.1%
16.9
14.2

100%
54.3
45.7

4.2

13.4

0.9

3.0

7.4
1.6
0.2*

23.7
5.0
0.6*

Note: Excludes persons who did not know if they had been
injured or treated for an injury. Detail may not add to total due to
rounding.
*Based on 10 or fewer sample cases.

Table 8. Treatment of injuries sustained by black/African
American violent crime victims, by crime seriousness,
2001-2005

Treatment
Total

Percent of violent victimization
resulting in injury
Serious
Simple
violent crime
assault
100%

100%

Not treated

47.9%

62.8%

Treated
At scene, home, neighbors, or friends
Doctor's office, clinic, health unit,
stadium, park
Hospital
Not admitted
Overnight stay
Other locations

52.1%
12.6

37.2%
14.5

2.3*

4.0*

28.3
8.3
0.4*

17.4
0.6*
0.7*

Note: Excludes persons who did not know if they received treatment.
Detail may not add to total due to rounding
*Based on 10 or fewer sample cases.

6 Black Victims of Violent Crime

Use of a weapon in nonfatal serious violence against
blacks did not change between 1993 and 2005

About half of all nonfatal violence against blacks was
reported to police between 2001 and 2005

In 2005 about 72% of serious violent crime against blacks
involved an offender armed with a weapon (figure 5). This
percentage was equivalent to that for whites and Hispanics.
A similar pattern was found in 1993.

Between 2001 and 2005, about 55% of all violent crimes
committed against blacks were reported to police. Violence
against black victims was more likely than violence against
white victims and as likely as violence against victims of
other racial/ethnic groups to be reported to police. Among
black victims, robbery (62%) and aggravated assault (67%)
were the violent crimes most likely to be reported (table 9).

Among black victims, in 2005 about 40% of serious violent
crime involved injury to the victim (figure 6). There was no
difference in the percentages between blacks, Hispanics,
and whites. Despite some fluctuations, the percent of serious violent crime in which the victim sustained an injury did
not substantially change between 1993 and 2005. A similar
pattern was found among Hispanics, while whites had a
slight increase in the percent injured.
Serious violent crime in which the offender had a
weapon, by victim race/Hispanic origin, 1993-2005

Percent of violent crime
reported to police,
2001-2005

Race/Hispanic origin
Black/African American*
White*
American Indian/Alaska Native*
Asian/Pacific Islander*
Hispanic/Latino

54.7%
47.7
58.2
51.3
52.1

*Not Hispanic or Latino.

Percent of serious violent crime
100%
Hispanic
Black*
75%

Table 9. Percent of violent victimization reported
to police by black/African American victims,
by type of crime, 2001-2005

White*
50%

25%

0%
1993

1995

1997

1999

2001

2003

2005

*Not Hispanic or Latino.

Type of crime

Percent of violent victimization
Reported
Not reported
Total
to police
to police

Rape/sexual assault
Robbery
Aggravated assault
Simple assault

100%
100%
100%
100%

28.4
61.5
66.7
49.5

71.6
38.5
33.3
50.5

Note: Excludes cases for which police reporting was unknown.

Figure 5

Serious violent crime in which the victim was injured,
by victim race/Hispanic origin, 1993-2005
Percent of serious violent crime
50%
White*
40%

Black*

30%
20%

Hispanic

10%
0%
1993

1995

1997

1999

2001

2003

2005

*Not Hispanic or Latino.
Figure 6

Black Victims of Violent Crime 7

Violence against blacks that was reported to police varied
by victim’s gender and age (table 10). Violence against
black females was more likely than violence against black
males (63% compared to 47%) to be reported to police.
Violent crime against the oldest blacks was more likely to
be reported than violent crime against the youngest. About
73% of violence against blacks age 65 or older were
reported to police, compared to about a third of violent
crime against black victims ages 12 to 15.
Police responded quickly to the majority of reported
nonfatal violence against blacks
According to black victims, police responded within an hour
in about 91% of reported violent victimizations. Police
response to nonfatal violence against blacks was similar to
that for whites and Hispanics.
Race/Hispanic origin of victim
who reported violent crime to
police

Percent of violent crime in which
police responded within an hour,
2001-2005

Black/African American*
White*
Hispanic/Latino

90.7%
88.7
90.9

*Not Hispanic or Latino.

In about 9% of violent crimes against blacks, the victim
sought help from nonpolice agencies that provided services
to victims of crime. Black victims of rape or sexual assault
were as likely as victims of other types of violent crime to
seek assistance from such agencies (table 11). Overall,
blacks were as likely as whites, but slightly more likely than
Hispanics to seek help from nonpolice victim agencies.

Race/Hispanic origin

Percent of violent crime in which victims
received help from nonpolice victim
agencies, 2001-2005

Black/African American*
White*
Hispanic/Latino

9.1%
8.5
6.5

*Not Hispanic or Latino.

The percentage of black victims of nonfatal violent crime
who contacted a nonpolice agency for help fluctuated
between 1993 and 2005. It reached 11% in 2005 which was
similar to the percentage in 1998 and 2003 (figure 7).
Table 11. Services received by black/African American
victims of violent crime from nonpolice victim agencies,
by type of crime, 2001-2005

Table 10. Violent crime against blacks/African Americans
reported to police, by victim gender and age, 2001-2005

Victim characteristics

Black victims of violence were slightly more likely than
Hispanics to use services of nonpolice victim agencies

Percent of violent victimization
Reported to Not reported to
Total
police
police

Gender
Male
Female

100%
100%

46.8
63.2

53.2
36.8

Age
12-15
16-19
20-24
25-34
35-49
50-64
65 or older

100%
100%
100%
100%
100%
100%
100%

33.3
56.3
52.7
63.7
64.6
56.3
72.5

66.7
43.7
47.3
36.3
35.4
43.7
27.5*

Note: Excludes cases for which police reporting was unknown.
*Based on 10 or fewer sample cases.

Percent of violent victimization
Assault
Robbery Aggravated Simple

Rape/sexual
Assistance received assault
Total
Received help
Did not receive help

100%

100%

100%

100%

14.5*
85.5

9.2
90.8

13.6
86.4

6.0
94.0

Note: Excludes data for which contact with nonpolice victim-assistance
agencies was unknown.
*Based on 10 or fewer sample cases.

Percent of violent crime against blacks/African Americans
in which victim received services from nonpolice victim
agencies, 1993-2005
Percent of violent crime
20%

15%

10%

5%

0%
1993

Figure 7

8 Black Victims of Violent Crime

1995

1997

1999

2001

2003

2005

Methodology
Data sources
This report presents data on rape, sexual assault, robbery,
aggravated assault, and simple assault against non-Hispanic blacks age 12 or older as measured by the National
Crime Victimization Survey (NCVS). The NCVS gathers
data on crimes against persons age 12 or older, reported
and not reported to the police, from a nationally representative sample of U.S. households. The NCVS provides information about victims (age, gender, race, Hispanic origin,
marital status, income, and educational level), offenders
(gender, race, approximate age, and victim-offender relationship) and the nature of the crime (time and place of
occurrence, use of weapons, nature of injury, and economic consequences).
Homicide data are from the Supplementary Homicide
Reports (SHR) to the Uniform Crime Reporting Program,
collected by the Federal Bureau of Investigation.
Between 1993 and 2005, about 2 million individuals age 12
or older were interviewed for the NCVS. For the overall
population, for the years measured, response rates varied
between 84% and 93% of eligible individuals. In 2005
about 134,000 persons were interviewed for the NCVS, of
which about 14,000 were non-Hispanic blacks.
Classification by race and Hispanic origin
Because the racial categories were changed in 2003, caution is warranted when examining race over time. Since
2003, two questions on the NCVS are asked to obtain information on the respondent's race and Hispanic origin: (1)
whether they are of Hispanic origin and (2) which race or
races they identify with. Respondents may chose white,
black/African American, American Indian/Alaska Native,
Asian, Native Hawaiian/Other Pacific Islander, and Other.
Respondents who select Other are asked to specify their
race. More than one race may be selected.
Prior to 2003, respondents were first asked to identify the
racial group they identified with, including white, black,
American Indian/Aleut/Eskimo, Asian/Pacific Islander, or
Other. Respondents who selected Other were not able to
specify a race. They were also not able to select more than
one racial group. After the question on race, respondents
were asked if they were of Hispanic origin.

When nonfatal violence was discussed in this report, black
and black/African American refer to non-Hispanic persons
who chose the black category prior to 2003 and the black/
African American category thereafter. Whites are non-Hispanic persons who selected the white category. Hispanic
and Hispanic/Latino categories refer to persons of any
race. American Indians and American Indian/Alaska
Natives are non-Hispanic persons who selected the American Indian/Aleut/Eskimo category prior to 2003 or the
American Indian/Alaska Native category since 2003.
Asians refer to non-Hispanics persons who chose the
Asian/Pacific Islander category prior to 2003 or the Asian or
Native Hawaiian/Other Pacific Islander category since
2003.
In this report, for homicide data from the Supplementary
Homicide Reports, black and white race categories include
both Hispanic and non-Hispanic persons.
Standard error computations
Comparisons of percentages and rates made in this report
were tested to determine if observed differences were statistically significant. Differences described as higher, lower,
or different passed a hypothesis test at the .05 level of statistical significance (95% confidence level). The tested difference was greater than twice the standard error of that
difference. For comparisons that were statistically significant at the 0.10 level (90% confidence level), "somewhat,"
"slightly," or marginally" is used to note the nature of the difference.
Significance testing calculations were conducted at the
Bureau of Justice Statistics using statistical programs
developed specifically for the NCVS by the U.S. Census
Bureau. These programs take into consideration many
aspects of the complex NCVS sample design when
calculating estimates.
Estimates based on 10 or fewer sample cases have high
relative standard errors. Care should be taken when
comparing such estimates to other estimates when both
are based on 10 or fewer sample cases.

Black Victims of Violent Crime 9

Appendix table 1. Violent victimization rate per 1,000 persons, by gender, age, and marital status,
by race/Hispanic origin of victims, 2001-2005
Characteristic
of victim

Black/African
Americana

Whitea

American Indian/ Asian/Pacific Hispanic/
Alaska Nativea Islandera
Latino

Total

28.7

22.8

56.8

10.6

24.3

Gender
Male
Female

32.9
25.2

26.0
19.8

58.8
55.2

13.3
8.1

28.0
20.5

Age
12-15
16-19
20-24
25-34
35-49
50-64
65 or older

54.1
65.4
48.5
29.4
19.5
14.8
4.0

52.7
55.6
51.1
28.1
20.4
11.0
2.5

64.3b
99.0
122.3
44.4
57.3
31.8b
--b

15.3
26.1
19.5
12.9
7.0
5.6
2.1b

41.0
39.7
35.8
24.5
17.0
11.0
4.5

Marital status
Never married
Married
Widowed
Divorced or separated

42.9
12.5
6.5
28.1

44.7
10.8
5.3
37.6

84.7
38.1
49.2b
37.7b

17.8
6.2
3.1b
19.7

36.4
12.0
9.3
37.8

--Less than 0.05.
a

Not Hispanic or Latino.

bBased

on 10 or fewer sample cases.

Appendix table 2. Violent victimization rate per 1,000 persons, by annual household income,
location of residence, and region, by race/Hispanic origin of victims, 2001-2005
Characteristic
of victim
Total

Black/African
Americana

Whitea

American Indian/ Asian/Pacific
Alaska Nativea
Islandera

Hispanic/
Latino

28.7

22.8

56.8

10.6

24.3

Annual household income
Less than $7,500
$7,500 to $14,999
$15,000 to $24,999
$25,000 to $34,999
$35,000 to $49,999
$50,000 to $74,999
$75,000 or more

45.1
39.2
43.3
29.1
25.6
21.9
22.7

50.2
37.0
27.8
26.0
25.1
22.7
17.9

77.3
46.6
54.6
65.7
44.7b
65.7
51.9b

17.0
13.6b
11.4
17.2
10.1
11.1
8.4

33.0
25.1
25.6
27.0
22.4
23.8
24.0

Location of residence
Urban
Suburban
Rural

36.3
23.6
13.2

31.7
20.5
20.1

82.2
62.6
37.0

10.9
10.4
11.3b

29.7
19.5
20.4

Region
Northeast
Midwest
South
West

30.3
42.6
22.0
37.0

18.0
23.6
20.6
30.7

76.4b
34.9
67.8
65.9

8.5
10.6
13.1
10.6

26.0
25.4
23.1
24.6

a

Not Hispanic or Latino.

b

Based on 10 or fewer sample cases.

10 Black Victims of Violent Crime

Appendix table 3. Serious violent victimization rate per 1,000 persons, by gender, age,
annual household income, and location of residence, by race/Hispanic origin of victims, 2001-2005
Characteristic
of victim

Black/African
Americana

Whitea

American Indian/ Asian/Pacific Hispanic/
Alaska Nativea
Islandera
Latino

Total

13.8

7.1

17.3

4.5

9.7

Gender
Male
Female

16.2
11.8

8.2
6.0

21.2
14.1

5.5
3.5

12.0
7.4

Age
12-15
16-19
20-24
25-34
35-49
50-64
65 and older

15.5
38.9
21.6
16.4
9.3
7.7
2.4

12.7
17.8
18.3
8.9
6.3
3.1
1.1

9.0b
14.9b
40.5b
10.9b
18.8b
20.8b
--b

3.4b
10.4b
9.2
4.7
3.5
2.8b
1.6b

13.5
18.0
14.8
9.7
6.9
4.5
2.3b

Annual household income
Less than $7,500
$7,500 to $14,999
$15,000 to $24,999
$25,000 to $34,999
$35,000 to $49,999
$50,000 to $74,999
$75,000 or more

23.3
19.6
22.1
14.0
11.2
10.7
7.9

22.6
13.0
9.6
7.9
7.5
6.4
4.6

21.4b
26.3b
9.5b
35.7b
6.3b
6.8b
13.7b

5.7b
3.3b
4.2b
6.9b
5.4b
4.8
3.9

16.0
11.7
10.7
9.5
9.8
8.4
9.3

Location of residence
Urban
Suburban
Rural

17.4
11.2
6.7

10.8
6.2
5.7

27.4
16.7b
12.2b

4.9
4.3
--b

12.1
7.7
7.3

Note: Serious violent victimization consists of rape/sexual assault, robbery, and aggravated assault and
excludes simple assault.
--Less than 0.05.
a

Not Hispanic or Latino.

bBased

on 10 or fewer sample cases.

Appendix table 4. Average annual number of
violent victimizations against blacks/African
Americans, by type of crime, 2001-2005
Type of crime
Homicide
Rape/sexual assault
Robbery
Aggravated assault
Simple assault

Number of victimizations
7,750
47,250
120,550
215,790
415,430

Appendix table 5. Percentage of nonfatal violent
victimization against blacks/African Americans,
by type of crime, 2001-2005
Type of crime

Percent

Total
Rape/sexual assault
Robbery
Aggravated assault
Simple assault

100%
5.9
15.1
27.0
52.0

Black Victims of Violent Crime 11

U.S. Department of Justice
Office of Justice Programs
Bureau of Justice Statistics

*NCJ~214258*

PRESORTED STANDARD
POSTAGE & FEES PAID
DOJ/BJS
Permit No. G-91

Washington, DC 20531

Official Business
Penalty for Private Use $300

The Bureau of Justice Statistics is the statistical
agency of the U.S. Department of Justice. Jeffrey L.
Sedgwick is director.
Erika Harrell, Ph.D., wrote this report, under the
supervision of Michael R. Rand. Wendy Lin-Kelly,
Cathy Maston and Patsy Klaus verified the report.
Tina Dorsey and Carolyn C. Williams produced and
edited the report, and Jayne Robinson prepared the
report for final printing, under the supervision of
Doris J. James.
August 2007, NCJ 214258
This report in portable document format and in
ASCII and its related statistical data and tables
are available at the BJS World Wide Web
Internet site: <http://www.ojp.usdoj.gov/bjs/
abstract/bvvc.htm>.

Office of Justice Programs
Innovation • Partnerships • Safer Neighborhoods
http://www.ojp.usdoj.gov

12 Black Victims of Violent Crime