
Doj Bjs Prison and Jail Inmates 2005
Download original document:
Document text
Document text
This text is machine-read, and may contain errors. Check the original document to verify accuracy.
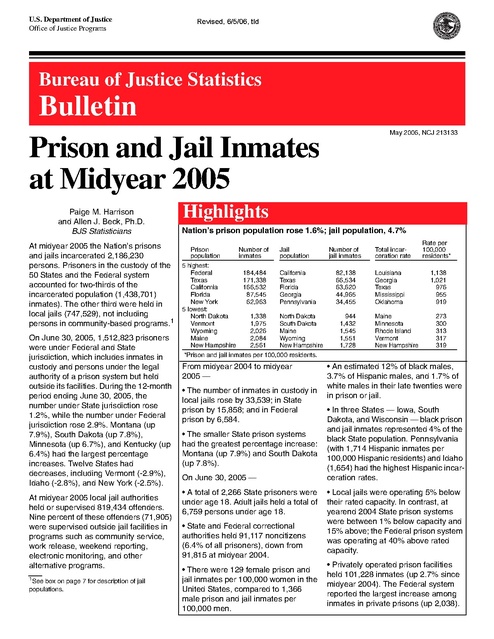
U.S. Department of Justice
Office of Justice Programs

Revised, 6/5/06, tld

Bureau of Justice Statistics

Bulletin
May 2006, NCJ 213133

Prison and Jail Inmates
at Midyear 2005
Paige M. Harrison
and Allen J. Beck, Ph.D.
BJS Statisticians
At midyear 2005 the Nation’s prisons
and jails incarcerated 2,186,230
persons. Prisoners in the custody of the
50 States and the Federal system
accounted for two-thirds of the
incarcerated population (1,438,701)
inmates). The other third were held in
local jails (747,529), not including
persons in community-based programs.1
On June 30, 2005, 1,512,823 prisoners
were under Federal and State
jurisdiction, which includes inmates in
custody and persons under the legal
authority of a prison system but held
outside its facilities. During the 12-month
period ending June 30, 2005, the
number under State jurisdiction rose
1.2%, while the number under Federal
jurisdiction rose 2.9%. Montana (up
7.9%), South Dakota (up 7.8%),
Minnesota (up 6.7%), and Kentucky (up
6.4%) had the largest percentage
increases. Twelve States had
decreases, including Vermont (-2.9%),
Idaho (-2.8%), and New York (-2.5%).
At midyear 2005 local jail authorities
held or supervised 819,434 offenders.
Nine percent of these offenders (71,905)
were supervised outside jail facilities in
programs such as community service,
work release, weekend reporting,
electronic monitoring, and other
alternative programs.
1

See box on page 7 for description of jail
populations.

Highlights
Nation’s prison population rose 1.6%; jail population, 4.7%
Prison
population
5 highest:
Federal
Texas
California
Florida
New York
5 lowest:
North Dakota
Vermont
Wyoming
Maine
New Hampshire

Number of
inmates
184,484
171,338
166,532
87,545
62,963
1,338
1,975
2,026
2,084
2,561

Jail
population
California
Texas
Florida
Georgia
Pennsylvania
North Dakota
South Dakota
Maine
Wyoming
New Hampshire

Number of
jail inmates
82,138
66,534
63,620
44,965
34,455
944
1,432
1,545
1,551
1,728

Total incarceration rate
Louisiana
Georgia
Texas
Mississippi
Oklahoma
Maine
Minnesota
Rhode Island
Vermont
New Hampshire

Rate per
100,000
residents*
1,138
1,021
976
955
919
273
300
313
317
319

*Prison and jail inmates per 100,000 residents.

From midyear 2004 to midyear
2005 —
• The number of inmates in custody in
local jails rose by 33,539; in State
prison by 15,858; and in Federal
prison by 6,584.
• The smaller State prison systems
had the greatest percentage increase:
Montana (up 7.9%) and South Dakota
(up 7.8%).
On June 30, 2005 —
• A total of 2,266 State prisoners were
under age 18. Adult jails held a total of
6,759 persons under age 18.
• State and Federal correctional
authorities held 91,117 noncitizens
(6.4% of all prisoners), down from
91,815 at midyear 2004.
• There were 129 female prison and
jail inmates per 100,000 women in the
United States, compared to 1,366
male prison and jail inmates per
100,000 men.

• An estimated 12% of black males,
3.7% of Hispanic males, and 1.7% of
white males in their late twenties were
in prison or jail.
• In three States — Iowa, South
Dakota, and Wisconsin — black prison
and jail inmates represented 4% of the
black State population. Pennsylvania
(with 1,714 Hispanic inmates per
100,000 Hispanic residents) and Idaho
(1,654) had the highest Hispanic incarceration rates.
• Local jails were operating 5% below
their rated capacity. In contrast, at
yearend 2004 State prison systems
were between 1% below capacity and
15% above; the Federal prison system
was operating at 40% above rated
capacity.
• Privately operated prison facilities
held 101,228 inmates (up 2.7% since
midyear 2004). The Federal system
reported the largest increase among
inmates in private prisons (up 2,038).

Incarceration rate for Nation
reaches 738 per 100,000 residents
On June 30, 2005, 1,431,468 inmates
were in the custody of State and
Federal prison authorities, and
747,529 inmates were in the custody
of local jail authorities. In the first 6
months of 2005, the Nation’s prison
population increased 16,622 (1.2%).
These data were collected in the 2005
National Prisoner Statistics program
and the 2005 Census of Jail Inmates.
(See Methodology, page 11, for a
description of data collections.)
Since midyear 2004 the total
incarcerated population has increased
2.6% (table 1). Including inmates in

privately operated facilities, the
number of inmates in State prisons
increased 1.3%; in Federal prisons,
3.9%; and in local jails, 4.7%. At
midyear 2005 Federal prisons
(including all secure and non-secure
public and private facilities) held 8.4%
of all inmates, up from 5.6% in 1995.
In the decade between yearend 1995
and midyear 2005, the incarceration
population grew an average of 3.4%
annually. During this period the
Federal and State prison populations
and the local jail population grew at the
average annual rates of 7.4%, 2.5%,
and 3.9%, respectively.

Table 1. Number of persons held in State or Federal prisons
or in local jails, 1995-2005
Total
inmates
in custody
1,585,586
1,935,753
1,961,247
2,033,331
2,081,580

Prisoners in custody
Inmates held
Total incarYear
Federal
State
in local jails
ceration ratea
1995
89,538
989,004
507,044
601
2000b
133,921
1,176,269
621,149
683
143,337
1,180,155
631,240
685
2001b
2002b
151,618
1,209,640
665,475
701
b
2003
161,673
1,222,135
691,301
712
b
2004
June
2,129,802
169,370
1,239,656
713,990
725
December
...
170,535
1,244,311
...
b
2005
June 30
2,186,230
175,954
1,255,514
747,529
738
Percent change,
2.6%
3.9%
1.3%
4.7%
6/30/04-6/30/05
Annual average
change,
3.4%
7.4%
2.5%
3.9%
12/31/95-6/30/05
Note: Jail counts are for midyear (June 30) and exclude persons who were supervised outside of a
jail facility. State and Federal prisoner counts for 1995-2003 are for December 31.
...Not available.
a
Persons in custody per 100,000 residents in each reference year.
b
Total counts include Federal inmates in non-secure privately operated facilities: 6,143 in 2000,
6,192 in 2001, 6,598 in 2002, 6,471 in 2003, 6,786 (June) and 7,065 (December) in 2004, and
7,233 in June, 2005.

Percent change during 6-month periods in the number of prisoners under
the jurisdiction of State correctional authorities, 1995-2005
Percent change
5%
4%
3%
2%

Jan.June

1%

JulyDec.

0%
-1%

1995 1996 1997 1998 1999 2000 2001 2002 2003 2004 2005

Figure 1

2 Prison and Jail Inmates at Midyear 2005

In the 12 months before midyear 2005,
the number of inmates in prison and
jails rose an estimated 56,428 inmates,
or 1,085 per week.
The rate of incarceration in prison and
jail in 2005 was 738 inmates per
100,000 U.S. residents — up from 725
at midyear 2004. At midyear 2005, 1 in
every 136 U.S. residents were in
prison or jail.
Federal system growth continues to
outpace that of States
The rate of growth of the State prison
population slowed between 1995 and
2001 and then began to rise. During
this time the percentage change in the
first 6 months of each year steadily
decreased, reaching a low of 0.6% in
2001, and then rose to 1.0% in 2005
(table 2). The percentage change in
the second 6 months of each year
showed a similar trend, resulting in an
actual decrease in State prison
populations for the second half of 2000
and 2001.
Since 1995 the Federal system has
grown at a much higher rate than the
States, peaking at 6.0% growth in the
first 6 months of 1999. In the first 6
months of 2005, the number of Federal
inmates increased 2.3%, more than
twice the rate of State growth.

Year
2005
2004
2003
2002
2001
2000
1999
1998
1997
1996
1995
...Not available.

Growth rates in Federal
prison population at 6-month
intervals
January
July to
to June
December
2.3%
3.6
4.2
3.0
5.1
5.4
6.0
5.3
4.4
3.5
4.7

...
0.6%
1.5
1.1
2.8
2.0
3.7
3.5
2.6
1.8
0.8

Some of the Federal growth since
1999 has been the result of the
transfer of responsibility for housing
sentenced felons from the District of
Columbia (DC). The transfer to Federal
facilities was completed by yearend
2001. Since then, the Federal system
has continued to receive sentenced
felons from DC Superior Court.
In absolute numbers the total increase
of 20,989 State and Federal prison
inmates between July 1, 2004, and
June 30, 2005, was significantly lower
than the growth during the previous
12-month period (27,637 inmates).
The percentage change from midyear
2004 to midyear 2005 (1.4%) was also
smaller than the percentage change
between 2003 and 2004 (1.9%). The
average annual growth from 1995 to
2005 was 3.0%.

Years
2004-05
2003-04
2002-03
2001-02
2000-01
1999-00
1998-99
1997-98
1996-97
1995-96
Average growth,
1995-2005

Annual increase in the
number of prisoners
under State or Federal
jurisdiction, July 1-June 30
Number
Percent
20,989
1.4%
27,637
1.9
44,260
3.1
20,587
1.5
14,587
1.0
30,710
2.3
56,059
4.4
57,726
4.7
56,710
4.9
57,507
5.2
38,677

3.0%

Federal system accounts for over
25% of inmate population increase
Twenty-five percent of the Nation’s
prison population growth during the
12 months ending June 30, 2005, was
accounted for by the 5,274 additional
inmates under jurisdiction of the
Federal system. During this 12-month
period, several States also
experienced substantial growth,
including Montana (7.9%), South
Dakota (7.8%), and Minnesota (6.7%).
Twelve States experienced a decline in
their prison population. Vermont had
the largest percentage decrease
(-2.9%), followed by Idaho (-2.8%) and
New York (-2.5%).

Table 2. Prisoners under the jurisdiction of State or Federal correctional
authorities, June 30, 2004, to June 30, 2005
Region and
jurisdiction
U.S. total
Federal
State

06/30/05

Total
12/31/04

06/30/04

1,512,823 1,495,373 1,491,834
184,484
180,328 179,210
1,328,339 1,315,045 1,312,624

Percent change from— Prison incar6/30/04 to 12/31/04 to ceration rate,
6/30/05
6/30/05
6/30/05a
1.4%
2.9
1.2

1.2%
2.3
1.0

488
55
433

Northeast
Connecticutb
Maine
Massachusettsc
New Hampshire
New Jersey
New York
Pennsylvania
Rhode Islandb
Vermontb

173,125
19,744
2,084
10,495
2,561
28,124
62,963
41,540
3,639
1,975

170,980
19,497
2,024
10,144
2,448
26,757
63,749
40,963
3,430
1,968

173,967
20,018
2,014
10,365
2,441
28,107
64,596
40,692
3,701
2,033

-0.5%
-1.4
3.5
1.3
4.9
0.1
-2.5
2.1
-1.7
-2.9

1.3%
1.3
3.0
3.5
4.6
5.1
-1.2
1.4
6.1
0.4

298
375
153
236
196
323
327
334
179
239

Midwest
Illinois
Indiana
Iowa
Kansas
Michigan
Minnesota
Missouri
Nebraska
North Dakota
Ohio
South Dakota
Wisconsin

252,406
44,669
24,244
8,578
9,042
49,014
9,187
31,066
4,284
1,338
44,976
3,344
22,664

250,702
44,054
24,008
8,525
8,966
48,883
8,758
31,188
4,130
1,327
44,798
3,095
22,970

249,732
44,379
23,760
8,611
9,152
48,591
8,613
30,542
4,042
1,266
44,770
3,101
22,905

1.1%
0.7
2.0
-0.4
-1.2
0.9
6.7
1.7
6.0
5.7
0.5
7.8
-1.1

0.7%
1.4
1.0
0.6
0.8
0.3
4.9
-0.4
3.7
0.8
0.4
8.0
-1.3

380
350
386
289
329
484
179
535
237
199
392
430
383

South
Alabama
Arkansas
Delawareb
Florida
Georgiad
Kentucky
Louisiana
Maryland
Mississippi
North Carolina
Oklahoma
South Carolina
Tennessee
Texas
Virginia
West Virginia

606,361
27,740
13,469
7,180
87,545
47,682
18,897
37,254
23,276
20,856
36,399
23,702
23,896
26,208
171,338
35,667
5,252

598,773
25,873
13,655
6,927
85,533
50,979
17,790
36,939
23,285
20,983
35,442
23,319
23,428
25,884
168,105
35,564
5,067

596,763
26,521
13,477
6,973
84,733
48,625
17,763
36,745
23,727
20,429
34,917
23,284
24,173
25,834
169,110
35,472
4,980

1.6%
4.6
-0.1
3.0
3.3
-1.9
6.4
1.4
-1.9
2.1
4.2
1.8
-1.1
1.4
1.3
0.5
5.5

1.3%
7.2
-1.4
3.7
2.4
-6.5
6.2
0.9
0.0
-0.6
2.7
1.6
2.0
1.3
1.9
0.3
3.7

542
587
480
478
492
526
432
824
405
682
361
655
538
440
703
471
287

West
Alaskab
Arizonad
California
Colorado
Hawaiib
Idaho
Montana
Nevada
New Mexico
Oregon
Utah
Washington
Wyoming

296,447
4,630
32,664
166,532
20,841
6,071
6,136
3,369
11,565
6,595
13,317
6,013
16,688
2,026

294,590
4,554
32,515
166,221
20,293
5,960
6,375
3,164
11,365
6,379
13,180
5,990
16,614
1,980

292,162
4,515
31,631
166,053
19,756
5,946
6,312
3,123
10,971
6,352
13,219
5,802
16,559
1,923

1.5%
2.5
3.3
0.3
5.5
2.1
-2.8
7.9
5.4
3.8
0.7
3.6
0.8
5.4

0.6%
1.7
0.5
0.2
2.7
1.9
-3.7
6.5
1.8
3.4
1.0
0.4
0.4
2.3

421
374
502
456
447
334
429
360
478
327
365
240
263
398

Note: The District of Columbia inmates sentenced to more than 1 year are the responsibility
of the Federal Bureau of Prisons.
a
The number of prisoners with a sentence of more than 1 year per 100,000 residents.
b
Prisons and jails form one integrated system. Data include total inmate population.
c
The incarceration rate includes an estimated 6,200 inmates sentenced to more than 1 year
but held in local jails or houses of corrections.
d
Population figures are based on custody counts.

Prison and Jail Inmates at Midyear 2005 3

Table 3. Prisoners held in private facilities, June 30,
2004, and June 30, 2005
Region and
jurisdiction
U.S. Total
Federalb
State

Number of inmates
6/30/05 06/30/04

Percent of
all inmatesa
6/30/05

101,228
26,544
74,684

98,570
24,506
74,064

6.7%
14.4
5.6

Northeast
Connecticut
Maine
Massachusetts
New Hampshire
New Jerseyc
New York
Pennsylvania
Rhode Island
Vermontc

3,214
0
0
0
0
2,437
0
403
0
374

3,328
0
0
0
0
2,566
0
361
0
401

1.9%
0
0
0
0
8.7
0
1.0
0
18.9

Midwest
Illinois
Indiana
Iowa
Kansas
Michigan
Minnesota
Missouri
Nebraska
North Dakota
Ohio
South Dakota
Wisconsin

2,961
0
88
0
0
479
403
0
0
57
1,924
10
0

3,854
0
655
0
0
480
268
0
0
47
1,903
8
493

1.2%
0
0.4
0
0
1.0
4.4
0
0
4.3
4.3
0.3
0

South
Alabama
Arkansas
Delaware
Florida
Georgia
Kentucky
Louisiana
Maryland
Mississippi
North Carolina
Oklahoma
South Carolina
Tennessee
Texas
Virginia
West Virginia

48,266
257
0
0
5,423
4,625
1,907
2,924
129
4,837
206
5,812
15
5,142
15,414
1,575
0

47,899
153
0
0
4,327
4,597
1,679
2,923
126
4,397
217
5,868
17
5,121
16,906
1,568
0

8.0%
0.9
0
0
6.2
9.7
10.1
7.8
0.6
23.2
0.6
24.5
0.1
19.6
9.0
4.4
0

West
Alaska
Arizona
California
Colorado
Hawaii
Idaho
Montana
Nevada
New Mexico
Oregon
Utah
Washingtonc
Wyoming

20,243
1,365
5,291
2,470
3,320
1,774
1,283
747
0
2,810
0
0
406
777

18,983
1,304
4,371
2,797
3,074
1,621
1,269
646
455
2,649
0
0
232
565

6.8%
29.5
16.2
1.5
15.9
29.2
20.9
22.2
0
42.6
0
0
2.4
38.4

aBased

on the total number of inmates under
State or Federal jurisdiction.
b
Includes Federal inmates held in privately operated
community correctional centers: 7,233 on 6/30/05 and
6,786 on 6/30/04.
c
Inmates held in out-of-State private facilities.

4 Prison and Jail Inmates at Midyear 2005

Prison incarceration rates continue to rise
The incarceration rate of State and Federal prisoners sentenced to
more than 1 year was 488 per 100,000 U.S. residents on June 30,
2005, up from 486 per 100,000 December 31, 2004. At midyear
2005, 10 States exceeded the national rate led by Louisiana with
824 sentenced prisoners per 100,000 State residents, Texas with
703, and Mississippi with 682. Nine States had rates that were less
than half of the national rate including Maine (153), Minnesota and
Rhode Island (both 179), and New Hampshire (196).
Overall, the State incarceration rate rose about 14% between
yearend 1995 and midyear 2005, from 379 to 433 prisoners per
100,000 U.S. residents. At the same time the Federal incarceration
rate rose 72%, from 32 to 55 prisoners per 100,000 U.S. residents.
Since yearend 1995 the total number of sentenced inmates per
100,000 residents has risen from 411 to 488. During this period
prison incarceration rates rose most in the Midwest (from 310 to
380), followed by the West (from 358 to 421) and the South (from
483 to 542). The rate in the Northwest decreased slightly from 301
to 298.

1995
2000
2001
2002
2003
2004
2005, midyear

Number of sentenced inmates per 100,000 U.S. residents
on December 31
State
Federal
Total*
379
32
411
426
42
469
422
48
470
427
49
476
430
52
482
432
54
486
433
55
488

*Totals may not add due to rounding.

A quarter of inmates in private facilities held for Federal
system
In the 12 months ending June 30, 2005, the number of prisoners
held in privately operated facilities increased from 98,570 to
101,228, an increase of 2.7% (table 3). Overall, private facilities
held 6.7% of all State and Federal inmates, up from 6.6% at
midyear 2004. The Federal system (26,544), Texas (15,414),
Oklahoma (5,812), and Florida (5,423) reported the largest number
of inmates in private facilities at midyear 2005. Four States, all in
the West, had at least a quarter of their prisoners in private
facilities.

2000
2001
2002
2003
2004
2005, midyear

Number of inmates held in privately operated facilities,
12/31/00 to 06/30/05
Total
State
Federal Percent of all inmates
90,542
75,018
15,524
6.5 %
91,953
72,702
19,251
6.5
93,912
73,638
20,274
6.5
95,522
73,657
21,865
6.5
98,901
74,133
24,768
6.6
101,228
74,684
26,544
6.7

Female inmate population
continues to rise at a faster rate
than male inmate population
From June 30, 2004, to June 30, 2005,
the number of women under the
jurisdiction of State and Federal prison
authorities grew from 102,691 to
106,174, an increase of 3.4% (table 4).
The number of men rose 1.3%, from
1,389,143 to 1,406,649. At midyear
2005 California, Texas, Florida, and
the Federal system housed 4 of every
10 female inmates.
Since 1995 the annual rate of growth in
the number of female inmates has
averaged 4.7%, higher than the 3.0%
average increase of male inmates.
Women accounted for 7.0% of all
inmates at midyear 2005, up from
6.1% at yearend 1995.
Relative to their number in the U.S.
resident population, men were over 14
times more likely than women to be
incarcerated in a State or Federal
prison. On June 30, 2005, the rate for
inmates serving a sentence of more
than 1 year was 64 female inmates per
100,000 women in the United States,
compared to 925 male inmates per
100,000 men.
Table 4. Number of prisoners under the
jurisdiction of State and Federal
correctional authorities, by gender,
1995, 2004, and 2005
Male
All inmates
6/30/2005
6/30/2004
12/31/1995
Percent change,
2004-2005
Average annual
change,19952005

1,406,649
1,389,143
1,057,406

Female
106,174
102,691
68,468

1.3%

3.4%

3.0%

4.7%

Sentenced to
more than 1 year
6/30/2005
1,349,223
6/30/2004
1,332,571
12/31/1995
1,021,059
Incarceration rate*
6/30/2005
6/30/2004
12/31/1995

925
922
789

96,778
93,632
63,963
64
63
47

Table 5. Number of inmates under age
18 held in State prisons, by gender,
June 30, 1995, and 2000-05

Year

Inmates under age 18
Total
Male
Female

2005
2004
2003
2002
2001
2000
1995

2,266
2,485
2,741
3,038
3,147
3,896
5,309

2,175
2,375
2,627
2,927
3,010
3,721
...

91
110
114
111
137
175
...

...Not available.

Number of State inmates under age
18 continues to decline
A total of 2,266 State prisoners were
under age 18 on June 30, 2005, down
from 2,485 at midyear 2004 (table 5).
The number of minors held in State
prisons peaked in 1995 at 5,309 and
has since decreased every year.
Overall, 0.2% of all State prisoners
were under age 18.
Six States reported more than 100
prisoners under age 18 at midyear
2005, led by Connecticut (383), New
York (223), Florida (185), and North
Carolina (169). Two of these States
reported an increase in their under age
18 populations held in prison during
the 12 months ending June 30, 2005,
while the rest experienced declines.
Three States reported no inmates
under age 18, and another 19 States
had 10 or fewer inmates under age 18.
Number of prisoners
under age 18
Percent
6/30/05 6/30/04 change
Connecticut*
383
321
19.3%
New York
223
225
-0.9
Florida
185
214
-13.6
North Carolina
169
192
-12.0
Texas
167
210
-20.5
South Carolina
120
114
5.3
*Includes local jail inmates under age 18.

Table 6. Number of noncitizens held in
State or Federal prisons at midyear,
1998-2005
Year
2005
2004
2003
2002
2001
2000
1999
1998
Percent change,
2004-2005

Total

Federal

State

91,117
91,815
90,568
88,677
87,917
89,676
88,811
77,099

35,285
34,422
34,456
33,873
33,886
36,090
33,765
27,682

55,832
57,393
56,112
54,804
54,031
53,586
55,046
49,417

-0.8%

2.5%

-2.7%

At midyear 2005, 61% of noncitizen
prisoners held in State facilities;
39% in Federal facilities
On June 30, 2005, 91,117 noncitizens
were in the custody of State or Federal
correctional authorities, down from
91,815 at midyear 2004 (table 6).
Overall, 6.4% of State and Federal
inmates at midyear 2005 were not U.S.
citizens. The noncitizen prisoner
population increased between 1998
and 1999, and since then it has
remained nearly stable, increasing
about 2.6% between midyear 1999
and midyear 2005.
At midyear 2005, 35,285 Federal
inmates were noncitizens,
representing about 19% of all
prisoners in Federal custody. California
(16,613), Texas (9,346), New York
(7,444), Florida (4,772), and Arizona
(4,179) held over 75% of all
noncitizens confined in State prisons.
Noncitizen prisoners accounted for
over 10% of the prison populations of
Arizona, New York, Nevada, and
California.
Noncitizens held in
prison
Percent of
6/30/05
6/30/04
all inmates
Federal
35,285
34,442
19.3%
California
16,613
17,890
10.1
Texas
9,346
9,048
6.0
New York*
7,444
8,027
11.8
Florida
4,772
4,834
5.6
Arizona
4,179
3,924
12.7
Nevada
1,402
1,242
12.6
North Carolina 1,182
868
3.2
Illinois
1,065
782
4.2
Colorado*
1,029
1,022
5.1
*Report foreign-born inmates rather
than noncitizens.

*The total number of prisoners with
a sentence of more than 1 year per
100,000 U.S. residents.

Prison and Jail Inmates at Midyear 2005 5

Growth continues as rising
admissions outpace releases

Table 7. Number of sentenced prisoners admitted and released from
State or Federal jurisdiction, by region and jurisdiction, 2000 and 2003-04

From 2000 to 2004 admissions to
State prison rose 11.5% (from 625,219
in 2000 to 697,066 in 2004). During
2004, 672,202 sentenced prisoners
were released from State prisons, up
from 604,858 in 2000 — an increase of
11.1% (table 7).
Admissions to the Federal prison
system increased 21.2% between
2000 and 2004 (from 43,732 to
52,982); releases increased 32.2%
(35,259 to 46,624). The number of
admissions to Federal prison in 2004
exceeded releases by more than 6,300
inmates.
New court commitments on the rise
Prior to 1998 growth in prison
admissions reflected increasing
numbers of offenders returning for
parole violations. Between 1990 and
1998 the number of returned parole
violators increased 54% (from 133,870
to 206,152), while the number of new
court commitments increased 7%
(from 323,069 to 347,270).
However, since 1998, parole violators
returned to prison increased by less
than 6%, while new court commitments
rose 18%.

Year

State prison admissions, by type,
1990, 1995, and 1998-2004
New court
Parole
Alla commitments violatorsb

1990
1995
1998
1999
2000
2001
2002
2003
2004

460,739
521,970
565,291
575,415
581,487
593,838
612,938
634,149
644,084

323,069
337,492
347,270
345,648
350,431
365,714
392,661
399,843
411,300

133,870
175,726
206,152
198,636
203,569
215,450
207,961
209,753
219,033

a
Based on inmates with a sentence of more
than 1 year. Excludes escapes, AWOL's, and
transfers to and from other jurisdictions.
b
Parole violators includes inmates with revoked
parole, other conditional release violators, and
intermediate sanctions imposed upon parolees
in lieu of revoking parole.

6 Prison and Jail Inmates at Midyear 2005

Admissions
Region and
jurisdiction
U.S. total
Federal
State
Northeast
Connecticut
Maine
Massachusetts
New Hampshire
New Jersey
New York
Pennsylvania
Rhode Islanda
Vermont

2004

2003

2000

Releases
Percent
change,
2000-04

697,066 686,437 625,219
52,982 52,288 43,732
644,084 634,149 581,487
66,441
6,577
655
2,278
1,099
13,886
24,664
14,319
755
2,208

71,171
6,571
931
2,185
1,139
14,398
26,040
14,039
3,881
1,987

11.5%
21.2
10.8

67,765 -2.0%
6,185
6.3
751 -12.8
2,062 10.5
1,051
4.6
13,653
1.7
27,601 -10.6
11,777 21.6
3,701
:
984
:

2004

2003

Percent
change,
2000 2000-04

672,202 656,384 604,858
46,624 44,199 35,259
625,578 612,185 569,599
68,760
6,707
636
2,391
1,080
14,418
26,043
14,396
828
2,261

72,609
6,890
782
2,302
1,188
15,043
27,467
13,268
3,684
1,985

11.1%
32.2
9.8

70,646
-2.7%
5,918 13.3
677
-6.1
2,889 -17.2
1,044
3.4
15,362
-6.1
28,828
-9.7
11,759 22.4
3,223
:
946
:

Midwest
Illinois
Indiana
Iowa
Kansas
Michigan
Minnesota
Missouri
Nebraska
North Dakota
Ohio
South Dakota
Wisconsin

144,002 136,924 117,776
39,293 36,063 29,344
16,029 15,615 11,876
4,364
5,545
4,656
4,519
4,605
5,002
13,248 12,659 12,169
6,604
5,914
4,406
18,281 17,151 14,454
2,085
1,959
1,688
1,008
992
605
28,196 26,506 23,780
2,304
1,915
1,400
8,071
8,000
8,396

22.3%
33.9
35.0
-6.3
-9.7
8.9
49.9
26.5
23.5
66.6
18.6
64.6
-3.9

143,497 136,590 114,382 25.5%
38,646 35,372 28,876 33.8
15,100 14,146 11,053 36.6
6,049
6,074
4,379 38.1
4,683
4,405
5,231 -10.5
13,723 13,910 10,874 26.2
5,849
5,437
4,244 37.8
17,307 16,967 13,346 29.7
2,029
1,953
1,503 35.0
917
870
598 53.3
28,170 27,369 24,793 13.6
2,428
1,980
1,327 83.0
8,596
8,107
8,158
5.4

South
Alabama
Arkansas
Delaware
Florida
Georgia
Kentucky
Louisiana
Maryland
Mississippi
North Carolina
Oklahoma
South Carolina
Tennessee
Texas
Virginia
West Virginia
West
Alaskab
Arizona
California
Colorado
Hawaii
Idaho
Montana
Nevada
New Mexico
Oregon
Utah
Washington
Wyoming

249,733 243,826 217,950
8,278
9,524
6,296
8,035
7,132
6,941
1,648
2,212
2,709
40,386 39,500 35,683
20,140 17,575 17,373
13,009
9,595
8,116
15,512 15,353 15,735
10,330 10,170 10,327
9,187
8,421
5,796
10,411
9,494
9,848
9,003
8,139
7,426
9,850
9,934
8,460
13,149 13,059 13,675
66,883 69,921 58,197
11,645
11,700
9,791
2,267
2,097
1,577
183,908 182,228 177,996
2,746
2,805
2,427
11,343
11,957
9,560
123,537 125,312 129,640
8,634
7,998
7,036
1,677
1,832
1,594
4,392
3,168
3,386
2,182
1,910
1,202
6,548
4,865
4,929
4,279
4,160
3,161
5,378
5,095
4,059
3,275
3,301
3,270
11,894
9,034
7,094
769
791
638

14.6%
31.5
15.8
:
13.2
15.9
60.3
-1.4
0.0
58.5
5.7
21.2
16.4
-3.8
14.9
18.9
43.8
3.3%
13.1
18.7
-4.7
22.7
5.2
29.7
81.5
32.8
35.4
32.5
0.2
:
20.5

238,628 231,896 210,777
9,156 10,167
7,136
7,457
7,120
6,308
2,013
2,129
2,260
36,908 34,679 33,994
18,211 17,333 14,797
10,740
9,208
7,733
15,009 13,841 14,536
10,531 10,207 10,004
8,607
7,679
4,940
9,315
9,116
9,687
8,432
8,164
6,628
10,060
9,829
8,676
13,295 13,768 13,893
65,800 65,169 59,776
11,148 11,606
9,148
1,946
1,881
1,261
174,693 171,090 173,794
2,726
2,736
2,599
10,190 10,391
9,100
117,762 118,646 129,621
8,001
7,113
5,881
1,667
1,504
1,379
3,480
3,033
2,697
1,897
1,642
1,031
4,715
4,800
4,374
4,090
3,943
3,383
4,910
4,483
3,371
3,050
3,088
2,897
11,547
9,067
6,764
658
644
697

Note: Excludes escapes, AWOL's, and transfers to and from other jurisdictions.
:Not calculated due to changes in reporting.
aChanged reporting in 2004 to include only prisoners sentenced to 1 year or more.
b
Alaska data may include some escapes, AWOLS, and transfers.

13.2%
28.3
18.2
:
8.6
23.1
38.9
3.3
5.3
74.2
-3.8
27.2
16.0
-4.3
10.1
21.9
54.3
0.5%
4.9
12.0
-9.1
36.0
20.9
29.0
84.0
7.8
20.9
45.7
5.3
:
-5.6

At midyear the Nation’s jails
supervised 819,434 persons
Based on the 2005 Census of Jail
Inmates, the Nation’s local jails held or
supervised 819,434 offenders on June
30, 2005 (table 8). Jail authorities
supervised 9% of these offenders
(71,905) in alternative programs
outside the jail facilities. A total of
747,529 persons were housed in local
jails.
Year
2005
2004
2003
2002
2001
2000
1995

Number held Jail incarcerain jail
tion rate*
747,529
713,990
691,301
665,475
631,240
621,149
507,044

252
243
238
231
222
220
193

Among persons under community
supervision by jail staff in 2005, 22%
were required to perform community
service (15,536) and 20% participated
in a weekend reporting program
(14,110). Sixteen percent of offenders
in the community were under
electronic monitoring; 21% were under
other pretrial supervision; 3% were in a
drug, alcohol, mental health, or other
type of medical treatment program;
and 10% were participating in a work
release or other alternative work
program.

Confinement status and type of program

Jail populations

Held in jail

Total

• receive individuals pending arraignment and hold them awaiting trial,
conviction, or sentencing
• readmit probation, parole, and bailbond violators and absconders
• temporarily detain juveniles pending
transfer to juvenile authorities
• hold mentally ill persons pending
their movement to appropriate mental
health facilities
• hold individuals for the military, for
protective custody, for contempt, and
for the courts as witnesses
• release convicted inmates to the
community upon completion of sentence
• transfer inmates to Federal, State, or
other authorities
• house inmates for Federal, State, or
other authorities because of crowding
of their facilities
• sometimes operate communitybased programs as alternatives to
incarceration.

Between July 1, 2004 and June 30,
2005, the number of persons held in
local jail facilities grew 4.7% — from
713,990 to 747,529. The 12-month
increase was larger than the average
annual growth (3.9%) from midyear
1995 to midyear 2005 (figure 2). The
4.7% growth in 2005 was the largest
annual growth since the 5.4% growth
in 2002. In absolute numbers the total
increase of 33,539 inmates in 2005
was the largest increase since 1997
(48,587 new inmates).

Table 8. Persons under jail supervision, by confinement status and type of
program, midyear 1995, 2000, and 2004-05

*Number of jail inmates per 100,000 U.S.
residents on July 1 of each year.

As defined in this report, jails are
locally operated correctional facilities
that confine persons before or after
adjudication. Inmates sentenced to
jail usually have a sentence of 1 year
or less. Jails also —

Number of jail inmates rose 33,539
in 12 months ending June 30, 2005

Supervised outside of a jail facilitya
Weekender programs
Electronic monitoring
Home detentionb
Day reporting
Community service
Other pretrial supervision
Other work programsc
Treatment programsd
Other

Number of persons under jail supervision
1995
2000
2004
2005
541,913

687,033

784,538

819,434

507,044

621,149

713,990

747,529

34,869
1,909
6,788
1,376
1,283
10,253
3,229
9,144
...
887

65,884
14,523
10,782
332
3,969
13,592
6,279
8,011
5,714
2,682

70,548
11,589
11,689
1,173
6,627
13,171
14,370
7,208
2,208
2,513

71,905
14,110
11,403
1,497
4,747
15,536
15,458
5,796
1,973
1,385

...Not available.

aExcludes persons supervised by a probation or parole agency.
bIncludes only those without electronic monitoring.
cIncludes persons in work release programs, work gangs, and other work alternative
dIncludes persons under drug, alcohol, mental health, and other medical treatment.

programs.

12-month growth rates for local jails, 1995-2005
Percent change in local jail population
from previous year, 1995-2005
10%
8%
6%
4%
2%
0%
1995 1996 1997 1998 1999 2000 2001 2002 2003 2004 2005
Figure 2

Prison and Jail Inmates at Midyear 2005 7

Revised, 6/5/06, tld

Jail incarceration rates rose in the
last 12-month period

annually in the past 10 years, while the
adult male population has grown 3.7%.

Since 1995 the Nation’s jail population
on a per capita basis has increased
31%. During this period the number of
jail inmates per 100,000 residents rose
from 193 to 252.

At midyear 2005 nearly 6 in 10 persons
in local jails were racial or ethnic
minorities. Whites made up 44.3% of
the jail population; blacks, 38.9%;
Hispanics, 15.0%; and other races
(American Indians, Alaska Natives,
Asians, Native Hawaiians, and other
Pacific Islanders), 1.7%.

Estimated
count

Jail incarceration ratea

Total

747,529

252

Gender
Male
Female

652,958
94,571

447
63

Race/Hispanic origin
Whiteb
Blackb
Hispanic/Latino
Otherc
Two or more

331,000
290,500
111,900
13,000
1,000

166
800
268
88
:

Note: Inmate counts by race/Hispanic origin
were estimated and rounded to the nearest 100.
Resident population figures were estimated for
July 1, 2005, based on the 2000 Census of
Population and Housing.
:Not calculated.
a
Number of jail inmates per 100,000 residents
in each group.
b
Non-Hispanic only.
c
Includes American Indians, Alaska Natives,
Asians, Native Hawaiians, and other Pacific
Islanders.

When individuals under community
supervision by jail authorities are
included with those in custody, the rate
was 276 persons per 100,000 U.S.
residents at midyear 2005.
A total of 6,759 persons under age 18
were housed in adult jails on June 30,
2005 (table 9). Approximately 85% of
these young inmates had been
convicted or were being held for trial as
adults in criminal court. The average
daily population for the year ending
June 30, 2005, was 733,442, an
increase of 3.9% from 2004 and 43.9%
from 1995.
Characteristics of jail inmate
population changing gradually
Male inmates made up 87.3% of the
local jail inmate population at midyear
2005 — 2.5 percentage points lower
than at midyear 1995 (table 10).
During the 12-month period ending
June 30, 2005, the number of adult
female inmates rose 8.0%, while the
number of adult male inmates
increased 4.3%. On average the adult
female jail population has grown 6.2%

8 Prison and Jail Inmates at Midyear 2005

On a per capita basis, men were over
7 times more likely than women to
have been held in a local jail on June
30, 2005. Blacks were nearly 5 times
more likely than whites, nearly 3 times
more likely than Hispanics, and over 9
times more likely than persons of other
races to have been in jail.

On June 30, 2005, 62% of the Nation’s
jail inmates were awaiting court action
on their current charge. An estimated
284,400 inmates held in local jails
were serving a sentence in jail,
awaiting sentencing, or serving time for
a probation or parole violation. As a
percent of all jail inmates, the percent
convicted has dropped from 44.0% at
midyear 2000 to 38.0% at midyear
2005.
At midyear 2005, 95% of jail capacity
was occupied
In the 12 months ending June 30,
2005, fewer beds than inmates were
added to the Nation’s jails. At midyear
2005 the rated capacity of local jails
was estimated at 789,001 beds, an
increase of 33,398 in 12 months

Table 9. Average daily population and the number of men, women,
and juveniles in local jails, midyear 1995, 2000, and 2004-05
1995

2000

2004

2005

Average daily populationa

509,828

618,319

706,242

733,442

Number of inmates, June 30
Adults
Male
Female
Juvenilesb
Held as adultsc
Held as juveniles

507,044
499,300
448,000
51,300
7,800
5,900
1,800

621,149
613,534
543,120
70,414
7,615
6,126
1,489

713,990
706,907
619,908
86,999
7,083
6,159
924

747,529
740,770
646,807
93,963
6,759
5,750
1,009

Note: Data are for June 30. Detailed data for 1995 were estimated and rounded
to the nearest 100.
a
The average daily population is the sum of the number of inmates in a jail each day
for a year, divided by the total number of days in the year.
b
Juveniles are persons held under the age of 18.
c
Includes juveniles who were tried or awaiting trial as adults.

Table 10. Gender, race, Hispanic origin, and conviction status of local jail inmates,
midyear 1995, 2000, and 2004-05
Characteristic
Total
Gender
Male
Female
Race/Hispanic origin
Whitea
Blacka
Hispanic
Otherb
Two or more racesc
Conviction status
Convicted
Male
Female
Unconvicted
Male
Female

2004

2005

100%

1995

100%

2000

100%

100%

89.8%
10.2

88.6%
11.4

87.7%
12.3

87.3%
12.7

40.1%
43.5
14.7
1.7

41.9%
41.3
15.1
1.6

44.4%
38.6
15.2
1.8

44.3%
38.9
15.0
1.7
0.1

44.0%
39.7
4.3
56.0
50.0
6.0

44.0%
39.0
5.0
56.0
50.0
6.0

39.7%
34.8
4.9
60.3
53.0
7.3

38.0%
33.2
4.8
62.0
54.2
7.7

Note: Detail may not add to total because of rounding.
a
Non-Hispanic only.
b
Includes American Indians, Alaska Natives, Asians, Native Hawaiians, and other Pacific Islanders.
c
More than one race was not requested prior to 2005.

(table 11). In the same 12-month
period, an additional 33,539 inmates
were added to the local jail population.
Rated capacity is the maximum
number of beds or inmates allocated
by State or local rating officials to each
jail facility. The growth in jail capacity
during the 12-month period ending
June 30, 2005, was larger (33,398)
than the average growth of 24,229
beds every 12 months since midyear
1995, and was the largest growth since
1999 (39,541).
As of June 30, 2005, 95% of the local
jail capacity was occupied.2 As a ratio
of all inmates housed in jail facilities to
total capacity, the percentage occupied
increased steadily since 2001 (up 5
percentage points).
A third of all jail inmates were held
in 4 States at midyear 2005
On June 30, 2005, 4 States
incarcerated more than a third of all
local jail inmates: California (82,138),
Texas (66,534), Florida (63,620),
2On

December 31, 2004, State prison systems
were between 1% below and 15% above capacity. The Federal prison system was operating at
40% above capacity. See Prisoners in 2004,
October 2005, NCJ 210677.

Table 11. Rated capacity of local jails
and percent of capacity occupied,
1995-2005

Year

Amount of
Rated
capacity
capacitya addedb

Percent of
capacity
occupiedc

2005

789,001

33,398

95%

2004
2003
2002
2001
2000
1999
1998
1997
1996
1995
Average
annual
increase,
1995-2005

755,603
736,471
713,899
699,309
677,787
652,321
612,780
586,564
562,971
545,763

19,132
22,572
14,590
21,522
25,466
39,541
26,216
23,593
17,208

94
94
93
90
92
93
97
97
92
93

3.8%

24,229

Note: Capacity data for 1995-98, and
2000-04 are survey estimates subject to
sampling error.
a
Rated capacity is the number of beds or
inmates assigned by a rating official to
facilities within each jurisdiction.
b
The number of beds added during the
12 months ending June 30 of each year.
c
The number of inmates divided by the rated
capacity times 100.

4,000 inmates. Collectively, jails in
these States held only 3.1% of the
Nation’s total jail population.

and Georgia (44,965) (table 12).
The 10 States with the smallest jail
populations each held fewer than

Table 12. Number of inmates in custody of State or Federal prisons
or local jails, June 30, 2005
Region and
jurisdiction
U.S. total
Federal
State

Total inmates
in custody

Local jail
inmates

Prison
inmatesa

Total incarJail incarceration rateb ceration rateb

2,186,230
183,187
2,003,043

747,529
~
747,529

1,438,701
183,187
1,255,514

738
62
676

252
~
252

Northeast
Connecticut
Maine
Massachusetts
New Hampshire
New Jersey
New York
Pennsylvania
Rhode Island
Vermont

269,683
19,087
3,608
22,778
4,184
46,411
92,769
75,507
3,364
1,975

97,503
~
1,545
12,619
1,728
17,621
29,535
34,455
~
~

172,180
19,087
2,063
10,159
2,456
28,790
63,234
41,052
3,364
1,975

494
544
273
356
319
532
482
607
313
317

178
~
117
197
132
202
153
277
~
~

Midwest
Illinois
Indiana
Iowa
Kansas
Michigan
Minnesota
Missouri
Nebraska
North Dakota
Ohio
South Dakota
Wisconsin

371,694
64,735
39,959
12,215
15,972
67,132
15,422
41,461
7,406
2,288
64,123
4,827
36,154

123,407
20,066
17,567
3,637
6,904
18,118
7,023
10,461
3,098
944
19,853
1,432
14,304

248,287
44,669
22,392
8,578
9,068
49,014
8,399
31,000
4,308
1,344
44,270
3,395
21,850

563
507
637
412
582
663
300
715
421
359
559
622
653

187
157
280
123
252
179
137
180
176
148
173
185
258

South
Alabama
Arkansas
Delaware
District of Columbia
Florida
Georgia
Kentucky
Louisiana
Maryland
Mississippi
North Carolina
Oklahoma
South Carolina
Tennessee
Texas
Virginia
West Virginia

909,990
40,561
18,693
6,916
3,552
148,521
92,647
30,034
51,458
35,601
27,902
53,854
32,593
35,298
43,678
223,195
57,444
8,043

366,091
15,143
6,125
~
3,552
63,620
44,965
16,761
31,867
12,386
11,422
17,171
9,585
12,226
24,233
66,534
26,424
4,077

543,899
25,418
12,568
6,916
~
84,901
47,682
13,273
19,591
23,215
16,480
36,683
23,008
23,072
19,445
156,661
31,020
3,966

846
890
673
820
~
835
1,021
720
1,138
636
955
620
919
830
732
976
759
443

341
332
220
~
645
358
496
402
704
221
391
198
270
287
406
291
349
224

West
Alaskac
Arizona
California
Colorado
Hawaii
Idaho
Montana
Nevada
New Mexico
Oregon
Utah
Washington
Wyoming

451,676
4,678
47,974
246,317
33,955
5,705
11,206
4,923
18,265
15,081
19,318
11,514
29,225
3,515

160,528
65
15,479
82,138
13,638
~
3,787
2,265
7,110
8,514
6,549
6,739
12,693
1,551

291,148
4,613
32,495
164,179
20,317
5,705
7,419
2,658
11,155
6,567
12,769
4,775
16,532
1,964

661
705
808
682
728
447
784
526
756
782
531
466
465
690

235
~
261
227
292
~
265
242
294
442
180
273
202
305

~Not applicable. Prisons and jails form one integrated system.
Data include total inmate population.
aAll inmates in public and private custody of State and Federal correctional authorities.
b
Number of inmates per 100,000 residents on June 30, 2005.
c
Except for 14 locally operated jails, Alaska has an integrated jail and prison system.

Prison and Jail Inmates at Midyear 2005 9

States outside of the South with rates
above the national average. The
combined prison and jail incarceration
rates totaled 846 in the South, followed
by 663 in the West, 563 in the
Midwest, and 494 in the Northeast.

The number of jail inmates per
100,000 U.S. residents totaled 252 on
June 30, 2005. Of the 21 States with
rates greater than that the national
average, 11 were in the South, 7 were
in the West, 2 in the Midwest, and 1
was in the Northeast. States that had
the largest number of jail inmates per
100,000 residents were Louisiana
(703), Georgia (496), New Mexico
(442), Tennessee (406), and Kentucky
(402). Five States — Maine (117), Iowa
(123), New Hampshire (132),
and Minnesota and North Dakota (both
137) — had rates that were less than
150 jail inmates per 100,000 State
residents. The District of Columbia, a
entirely urban jurisdiction, had a rate of
645 jail inmates.

States also varied in the percentage of
inmates held in local jails. Among all
States at midyear 2005, 37% of
inmates were housed in local facilities.
Louisiana (with the highest
incarceration rate) also had the largest
percentage housed in local facilities
(62%). Local jails in Utah (59%), New
Mexico (57%), Kentucky (56%),
Tennessee (55%), Massachusetts
(55%), and West Virginia (51%) also
held more than half of their State’s
inmates. Excluding States with
integrated prison and jail systems,
Missouri held the largest proportion of
its inmates in its State prisons (75%),
followed by Michigan (73%).

Louisiana and Georgia held at least
1% of their State population in
prison or jail
More than 1% of residents in Louisiana
and Georgia were in prison or jail at
midyear 2005. Louisiana led the Nation
with 1,138 prison and jail inmates per
100,000 State residents, followed by
Georgia (1,021) and Texas (976).
Maine (273), Minnesota (300), Rhode
Island (313), and Vermont (317) held
the fewest inmates relative to their
State populations.

An estimated 12% of black males in
their late twenties were in prison or
jail in 2005
When total incarceration rates are
estimated separately by age group,
black males in their twenties and
thirties are found to have very high
rates relative to other groups
(table 13). Among the nearly 2.2
million offenders incarcerated on June
30, 2005, an estimated 548,300 were
black males between the ages of 20
and 39. Of black non-Hispanic males
age 25 to 29, 11.9% were in prison or
jail, compared to 3.9% of Hispanic
males and about 1.7% of white males

Southern States had significantly
higher total incarceration rates than
States in other regions. Ten of the 14
States with rates higher than the
national total were in the South.
Arizona (808 inmates per 100,000
residents), New Mexico (782), Idaho
(784), and Nevada (752) were the only

Table 13. Number of inmates in State or Federal prisons and local jails
per 100,000 residents, by gender, race, Hispanic origin, and age, June 30, 2005

Totala

Age
Total
18-19
20-24
25-29
30-34
35-39
40-44
45-54
55 or older

1,371
1,739
3,291
3,462
3,122
2,765
2,240
1,214
260

Number of inmates per 100,000 residents of each group
Males
Females
Whiteb Blackb Hispanic
Totala
Whiteb
Blackb
709
905
1,627
1,682
1,693
1,562
1,299
658
167

4,682
5,306
10,486
11,955
10,472
9,425
7,575
4,401
879

1,856
2,072
3,878
3,884
3,640
3,111
2,649
1,873
562

129
116
277
299
342
364
264
110
12

88
76
206
220
255
260
177
70
9

347
257
611
720
855
957
751
323
26

Hispanic
144
168
317
287
312
322
264
138
26

Note: Based on the U.S. resident population for January 1, 2005, by gender, race, and Hispanic
origin. Detailed categories exclude persons who reported two or more races.
a
Includes American Indians, Alaska Natives, Asians, Native Hawaiians, and
other Pacific Islanders.
b
Excludes Hispanics.

10

Prison and Jail Inmates at Midyear 2005

in the same age group. In general, the
incarceration rates for black males of
all ages were 5 to 7 times greater than
those for white males in the same age
groups.
Female incarceration rates, though
significantly lower than male rates at
every age, reveal similar racial and
ethnic disparities. The incarceration
rate for Black non-Hispanic females
was 347 per 100,000 almost 22 times
higher than the rate for Hispanic
females (144 per 100,000) and 4 times
higher than the rate for white females
(88 per 100,000). These differences
among white, black, and Hispanic
females were consistent across all age
groups.
Black incarceration rate highest in
South Dakota; Hispanic rate highest
in Pennsylvania
When incarceration rates by State
(excluding Federal inmates) are
estimated separately by gender, race,
and Hispanic origin, male rates are
found to be 10 times higher than
female rates; black rates 5½ times
higher than white rates; and Hispanic
rates nearly 2 times higher than white
rates (table 14). The largest
differences in incarceration rates
between men and women are in New
York (16½ times higher for men) and
Rhode Island (16 times higher for
men). The largest differences in rates
between whites and blacks are in Iowa
(14 times higher for blacks) and
Connecticut, New Jersey, and Vermont
(more than 12 times higher for blacks),
and between whites and Hispanics in
Connecticut and Massachusetts (more
than 6 times higher for Hispanics).

Table 14. Number of inmates in State prisons and local jails per 100,000
residents, by gender, race, and Hispanic origin, June 30, 2005
Region and
jurisdiction

Male

All States

Number of inmates per 100,000 residentsa
Female
Whiteb
Blackb
Hispanic

1,249

121

412

2,290

742

Northeast
Connecticut
Maine
Massachusetts
New Hampshire
New Jersey
New York
Pennsylvania
Rhode Island
Vermont

947
1,030
513
687
590
1,019
935
1,155
607
598

66
85
44
45
56
70
57
92
38
45

225
211
262
201
289
190
174
305
191
304

2,060
2,532
1,992
1,635
2,666
2,352
1,627
2,792
1,838
3,797

895
1,401
/
1,229
1,063
630
778
1,714
631
/

Midwest
Illinois
Indiana
Iowa
Kansas
Michigan
Minnesota
Missouri
Nebraska
North Dakota
Ohio
South Dakota
Wisconsin

1,046
951
1,165
751
1,054
1,262
553
1,323
756
632
1,040
1,092
1,209

97
79
126
83
117
85
52
133
93
87
103
157
107

351
223
463
309
443
412
212
487
290
267
344
470
415

2,278
2,020
2,526
4,200
3,096
2,262
1,937
2,556
2,418
2,683
2,196
4,710
4,416

450
415
579
764
/
397
/
587
739
848
613
/
/

South
Alabama
Arkansas
Delaware
District of Columbiac
Florida
Georgia
Kentucky
Louisiana
Maryland
Mississippi
North Carolina
Oklahoma
South Carolina
Tennessee
Texas
Virginia
West Virginia

1,559
1,665
1,231
1,547
1,202
1,541
1,877
1,287
2,134
1,219
1,790
1,154
1,645
1,558
1,339
1,772
1,393
817

157
161
136
128
145
155
184
173
195
88
168
104
209
137
151
186
144
84

536
542
478
396
56
588
623
561
523
288
503
320
740
415
487
667
396
392

2,156
1,916
1,846
2,517
1,065
2,615
2,068
2,793
2,452
1,579
1,742
1,727
3,252
1,856
2,006
3,162
2,331
2,188

399
/
288
683
267
382
576
757
244
/
611
/
832
476
561
830
487
211

West
Alaska
Arizona
California
Colorado
Hawaii
Idaho
Montana
Nevada
New Mexico
Oregon
Utah
Washington
Wyoming

1,193
1,232
1,443
1,246
1,279
787
1,379
926
1,319
1,421
965
803
831
1,189

130
141
171
119
166
109
185
129
173
163
101
127
101
184

500
500
590
460
525
453
675
433
627
:
502
392
393
:

3,014
2,163
3,294
2,992
3,491
851
2,869
3,569
2,916
:
2,930
3,588
2,522
:

839
380
1,075
782
1,042
185
1,654
846
621
:
573
838
527
:

Note: Counts by race and Hispanic origin were estimated, using data reported in the Census
of Jail Inmates, 2005, and the National Prisoners Statistics, June 30, 2005. To correct for
missing data, reported counts for each group were aggregated by State, converted to percentages, and then multiplied by the total prison and jail custody counts. These estimates
were then summed to provide the estimated number of State inmates in each group.
/Not reported.
:Not calculated.
a
Based on intercensal estimates of each State’s resident population (by race and Hispanic
origin) for July 1, 2004, and then adjusted to the State resident totals for July 1, 2005.
b
Excludes Hispanics.
c
Excludes all inmates sentenced to more than 1 year held by the Federal Bureau of Prisons.

South Dakota led the Nation with an
estimated 4,710 black prison and jail
inmates per 100,000 black State
residents, followed by Wisconsin
(4,416), and Iowa (4,200).
Pennsylvania with 1,714 Hispanic
inmates per 100,000 Hispanic
residents, Idaho (1,654), and
Connecticut (1,401) had the highest
Hispanic incarceration rates.
Methodology
National Prisoner Statistics
The Bureau of Justice Statistics (BJS),
with the U.S. Census Bureau as its
collection agent, obtains yearend and
midyear counts of prisoners from
departments of correction in each of
the 50 States and the Federal Bureau
of Prisons.
The National Prisoner Statistics (NPS)
distinguishes prisoners in custody from
those under jurisdiction. To have
custody of a prisoner, a State must
hold that person in one of its facilities.
To have jurisdiction means that a State
has legal authority over the prisoner.
Prisoners under a State’s jurisdiction
may be in the custody of a local jail,
another State=s prison, or other
correctional facility. Some States are
unable to provide both custody and
jurisdiction counts.
Excluded from NPS counts are
persons confined in locally
administered confinement facilities
who are under the jurisdiction of local
authorities. NPS counts include all
inmates in State-operated facilities in
Alaska, Connecticut, Delaware,
Hawaii, Rhode Island, and Vermont,
which have combined jail-prison
systems. NPS excludes inmates held
by the District of Columbia (DC), which
as of yearend 2001 operated only a jail
system. (See National Prisoner
Statistics jurisdiction notes, page 13,
appended to the report in portable
document format (pdf) on the BJS
website <http://www.ojp.usdoj.gov/bjs/
abstract/pjim05.htm>.)

Prison and Jail Inmates at Midyear 2005

11

U.S. Department of Justice
Office of Justice Programs
Bureau of Justice Statistics

*NCJ~213133*

PRESORTED STANDARD
POSTAGE & FEES PAID
DOJ/BJS
Permit No. G-91

Washington, DC 20531

Official Business
Penalty for Private Use $300

Census of Jail Inmates, 2005
The 2005 Census of Jail Inmates was
the eighth in a series. Previous
censuses of jails were conducted in
1970, 1972, 1978, 1983, 1988, 1993,
and 1999. To reduce respondent
burden and improve data quality and
timeliness, the census was split into
two parts: the Census of Jail Inmates,
2005, and the Census of Jail Facilities,
2006, (conducted on March 31, 2006).
As in previous censuses, the U.S.
Census Bureau was the collection
agent for BJS.
The 2005 Census of Jail Inmates
included all locally administered
confinement facilities (under the
authority of 2,853 local jurisdictions).
These facilities are intended for adults
but sometimes hold juveniles. They
hold inmates beyond arraignment and
are staffed by municipal or county
employees. The census also included
42 jails that were privately operated
under contract for local governments
and 65 multi-jurisdiction jails that were
administered by two or more local
governments. Included in the census,
but excluded from this report due to
lack of comparability with previous
12

Prison and Jail Inmates at Midyear 2005

survey years, were 13 facilities
maintained by the Federal Bureau of
Prisons and functioning as jails.
Excluded from the census were
temporary holding facilities, such as
drunk tanks and police lockups, that do
not hold persons after they are formally
charged in court (usually within 72
hours of arrest). Also excluded were
State-operated facilities in Alaska,
Connecticut, Delaware, Hawaii, Rhode
Island, and Vermont, which have
combined jail-prison systems.
Fourteen locally operated jails in
Alaska were included.
All jail jurisdictions responded to the
census, resulting in a 100% response
rate.
This report in portable document
format and in ASCII and its related
statistical data and tables are
available at the BJS World Wide
Web Internet site: <http://
www.ojp.usdoj.gov/bjs/>

Office of Justice Programs
Partnerships for Safer Communities
http://www.ojp.usdoj.gov

The Bureau of Justice Statistics is
the statistical agency of the U.S.
Department of Justice. Jeffrey L.
Sedgwick is Director. BJS Bulletins
present the first release of findings
from permanent data collection
programs such as the National
Prisoner Statistics program and the
Census of Jail Inmates.
Paige M. Harrison and Allen J.
Beck wrote this report. Jennifer C.
Karberg and Seri Palla verified the
report and provided statistical
assistance. Tina Dorsey and
Marianne W. Zawitz produced and
edited the report.
Lisa A. McNelis and Pamela H.
Butler carried out data collection
and processing under the
supervision of Charlene M. Sebold,
Governments Division, Census
Bureau, U.S. Department of
Commerce. Martha A. Greene and
Patricia D. Torreyson assisted in
data collection. Duane H.
Cavanaugh and Diron J. Gaskins
provided technical assistance.
May 2006, NCJ 213133

National Prisoner Statistics
jurisdiction notes
Alaska — Prisons and jails form one
integrated system. All NPS data
include jail and prison populations.
Jurisdiction counts exclude inmates
held in local jails that are operated by
communities.
Arizona — Counts are based on
custody data.
California — Jurisdiction counts
include unsentenced inmates
temporarily housed in local jails or in
hospitals.
Colorado — Counts include 71
inmates housed in local jails, 3,074
inmates in Colorado contract, and 235
inmates in the Youthful Offender
System, which was established
primarily for violent juvenile offenders.
Counts of inmates with sentences of
more than 1 year include an
undetermined number with a sentence
of 1 year or less. Report foreign-born
inmates rather than noncitizens.
Connecticut — Prisons and jails form
one integrated system. All NPS data
include jail and prison populations.
Delaware — Prisons and jails form
one integrated system. All NPS data
include jail and prison populations.
Federal — Custody counts include
inmates housed in privately operated
secure facilities under contract with
BOP or with a State or local
government that has an
intergovernmental agreement. Also
includes inmates held in privately
operated community correctional
centers. Racial categories include
42,028 inmates of Hispanic origin.
Georgia — Counts are based on
custody data.

Hawaii — Prisons and jails form one
integrated system. All NPS data
include jail and prison populations.
Illinois — Counts are based on
jurisdiction data. Counts of inmates
with sentences of more than 1 year
include an undetermined number with
a sentence of 1 year.
Iowa — Counts are based on custody
data. Counts of inmates with
sentences of more than 1 year include
an undetermined number with a
sentence of 1 year or less and
unsentenced inmates.
Kansas — Counts of inmates with
sentences of more than 1 year include
an undetermined number with a
sentence of 1 year or less.
Louisiana — Counts include 16,218
males and 1,445 females housed in
local jails as a result of a partnership
with the Louisiana Sheriff’s Association
and local authorities.
Maryland — Counts by sentence
length are estimates extracted from
actual sentence length breakdowns
from automated data and applied to
totals based on manual data. Report
foreign-born inmates rather than
noncitizens.

New Jersey — Counts of inmates with
sentences of more than 1 year include
an undetermined number with a
sentence of 1 year.
New York — Report foreign-born
inmates rather than noncitizens.
Ohio — Counts of inmates with
sentences of more than 1 year include
an undetermined number with a
sentence of 1 year or less.
Oklahoma — Counts of inmates with
sentences of more than 1 year include
an undetermined number with a
sentence of 1 year or less.
Rhode Island — Prisons and jails
form one integrated system. All NPS
data include jail and prison
populations.
Tennessee — Report foreign-born
inmates rather than noncitizens.
Vermont — Prisons and jails form an
integrated system. All NPS data
include jail and prison populations.
Wisconsin — Custody counts exclude
inmates held in non-Wisconsin DOC
facilities under contract.

Massachusetts — Jurisdiction counts
exclude approximately 6,200 male
inmates in the county system (local
jails and houses of correction) serving
a sentence of over 1 year. These male
inmates are included in
Massachusetts' incarceration rate. By
law offenders may be sentenced to
terms up to 2½ years in locally
operated jails and correctional
institutions.
Michigan — Jurisdictions counts
exclude inmates who are out to court.
Missouri — Report foreign-born
inmates rather than noncitizens.

Prison and Jail Inmates at Midyear 2005

13