Taser Use of Force 448 Uses Slideshow
Download original document:

Document text

Document text
This text is machine-read, and may contain errors. Check the original document to verify accuracy.
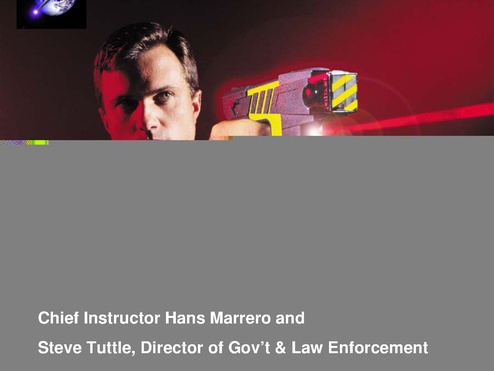
Chief Instructor Hans Marrero and
Steve Tuttle, Director of Gov’t & Law Enforcement

DID WE ACCOMPLISH OUR
MISSION TO:
“REDUCE OFFICER AND
SUSPECT INJURIES BY
STOPPING THREATS FROM
A SAFE DISTANCE?”

Success Percent by
Level of Firing
Total number of reports

448

Percent Successful:

93.08%

_________________________________________
Darts Fired at Subject:

257

92.61%

Laser Only:

100

98.00%

Spark Demo

13

100%

Stun Gun Application

69

85.51%

Out of Events 439

Distance of Firings
1-3 Feet
3-7 Feet
7-11 Feet
11-15 Feet
16-21 Feet

21
90
89
47
1

8.43%
36.29%
35.88%
18.95%
.04%

Some of this information was not provided
and will not add up to 257 (248).

Success Percent by
Distance of Firing
Distance

# of Incidents

Success Rate

1-3 Feet:

22

95.45%

3-7 Feet:

92

95.65%

7-11 Feet:

91

91.21%

11-15 Feet:

52

90.38%

15-21 Feet:

5

100.00%

* The total number may vary from the other slides as this data query
was run at a later date, with a larger number of uses in the database.

Length of discharge
1 seconds

1

2 seconds

8

3 seconds

11

4 seconds

3

5 seconds

103

More than 1 cycle

99

Number of probes that
hit the suspect
1 Probe Hit

2

2 Probe Hit

60

3 Probe Hit

5

4 Probe Hit

1

Type of Incident Involving
the Use of M26
Officer Assault
Warrant Service
Civil Disturbance
Barricaded
Suicidal
Resisting Arrest
Violent

3.35%
5.36%
6.70%
8.71%
20.98%
41.29%
44.42%

There is more than 100% as each event may involve one or more types of incident

Threats Involved
Deadly Assault
2.68%
Defensive Resist
9.82%
Active Aggression 23.21%
Verbally Non-Comp 31.03%
Total Incidents

448

This was the most heavily “edited” section and required thorough followup.

Types of Weapons Used
by Suspects
Blunt Weapon

2.23%

Firearm

4.02%

Edged Weapon

13.84%

Suspect’s Influence
PCP
Misc. Drugs
Cocaine
Meth
EDP
Alcohol

1.34%
3.13%
5.58%
6.03%
34.15%
42.86%

Type of Incident Involving
the Use of M26
Officer Assault
Warrant Service
Civil Disturbance
Barricaded
Suicidal
Resisting Arrest
Violent

3.35%
5.36%
6.70%
8.71%
20.98%
41.29%
44.42%

There is more than 100% as each event may involve one or more types of incident

Failures in Stun Gun Mode
Low Nerve/Muscle
Miss
Single Dart
Weapon Problem

9
2
1
4

56.25%
12.50%
6.25%
25.00%

Note, this includes all failures. For example, the probes may have been
fired, and missed, but then the stun gun was applied.

Failures when Darts Deploy
Door Closed
Dropped/Broken
Low Battery
Unknown
Weapon Problem
Cartridge Failure
Miss
Propped Up
Operator Error
Single Dart
Low Nerve/Muscle
Clothing

1
1
1
1
1
2
2
2
4
5
7
15

2.38%
2.38%
2.38%
2.38%
2.38%
4.76%
4.76%
4.76%
9.52%
11.90%
16.67%
35.71%

Total of All Failures
Door Closed on Wires
Low Battery
Unknown
Decided Not to Use
Cartridge Failure
Dropped/Broken
Propped Up
Miss
Operator Error
Weapon Problem
Single Dart
Clothing
Low Nerve/Muscle

1
1
1
1
2
2
2
4
4
5
6
15
16

1.67%
1.67%
1.67%
1.67%
3.33%
3.33%
3.33%
6.67%
6.67%
8.33%
10.00%
25.00%
26.66%

Location of Use
Indoor
Jail / Hospital
or
Indoor + Jails

125 29.76%
82 19.52%

Outdoor

213 50.71%

207 49.29%

This represents 420 events (some reports did not disclose location)

Injuries to Suspects
Minor
56
13.56%
(Puncture wounds from probes & misc. cuts)
Moderate
5
1.21%
(Abrasion, skinned knee, carpet burn, testicle shot,
penis shot, cut to mouth, cuts from falling onto glass)
Severe
3
0. 73%
(Dog bites, self-infliction, officer battle)
None

349

84.50%

Injuries to Officers
Minor
20
4.76%
(Officers involved with fighting suspects or arresting
them)
Moderate
1
0.23%
(Knife thrown at officer cutting arm)
Severe

0

0%

None

399

95%

Reno Police Use Quote
• 8/21/00 M26 shot fired at suicidal man with shard
of broken glass. Subject slashed wrists, ignored
verbal commands and rushed Sgt. Pittman.
Subject dropped by M26 safely.
• “The attending ER physician removed the probes
and commented on how little damage was done in
comparison to the damage he usually saw after a
subject was involved in a physical confrontation
with officers. Probes and self-inflicted slash to left
wrist and no injuries to officers.”

Comparison of Injuries
TASER Technology Reduces Injuries
80%

78%

78%

80%
70%

60%

Suspect
Injured

60%
50%

45%
36%

40%

29%

30%
20%

16%

18%
11%

10%

Chemical
Spray

Swarm

Kick

Baton

Punch

Flashlight

0%

Misc. body
force

5%

0% 0%

Officer
Injured /
Affected

TASER

20%

21%

29%

Force Type

Source: Study of Use of Force at Los Angeles Police Department, Greg Meyer. Statistics are for
7-Watt TASER technology deployed at LAPD.
Original Study Available at http://home.earthlink.net/~gregmeyer/injury.html on the internet.

DID WE ACCOMPLISH OUR
MISSION TO:
“REDUCE OFFICER AND
SUSPECT INJURIES BY
STOPPING THREATS FROM
A SAFE DISTANCE?”
YES

Are there any
Questions?

